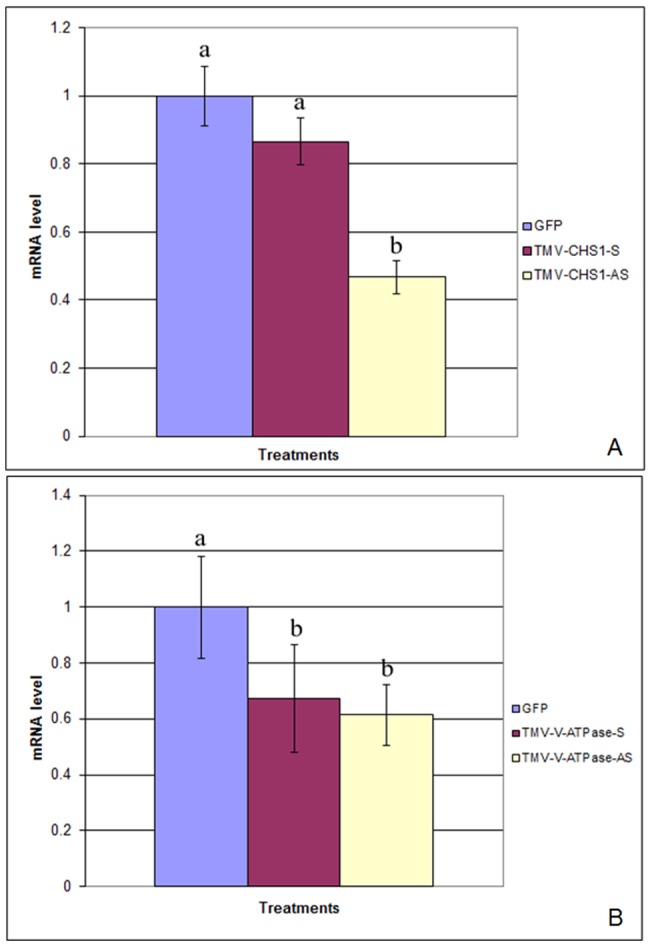
Figure 3. Relative levels of CHS1 (A) and V-ATPase (B) mRNAs in P. citri after feeding on N. benthamiana plants inoculated with recombinant TMV expressing P. citri CHS1 and V-ATPase fragments.

qRT-PCR results of CHS1 (A) and V-ATPase (B) mRNA levels from P. citri after feeding on N. benthamiana plants infected with recombinant TMVs. TMV-GFP (pJL24) was used as a control and sense and antisense inserts of P. citri CHS1/V-ATPase sequences were compared. Total RNA was extracted after 12 days feeding on plants and used for cDNA synthesis. qRT-PCR was performed using primers described in Table 3. The 18S ribosomal RNA was used as an endogenous control in all experiments. Calculation of mRNA levels between control and treated groups was carried out by the comparative CT or 2–ΔΔCt method and analyzed by ANOVA using statistix 8.1 software. Numbers with the same letter indicate homogenous groups at p<0.01 (LSD 0.04 and 0.21) for CHS1 and V-ATPase respectively. All experiments were performed twice and data were used collectively.
