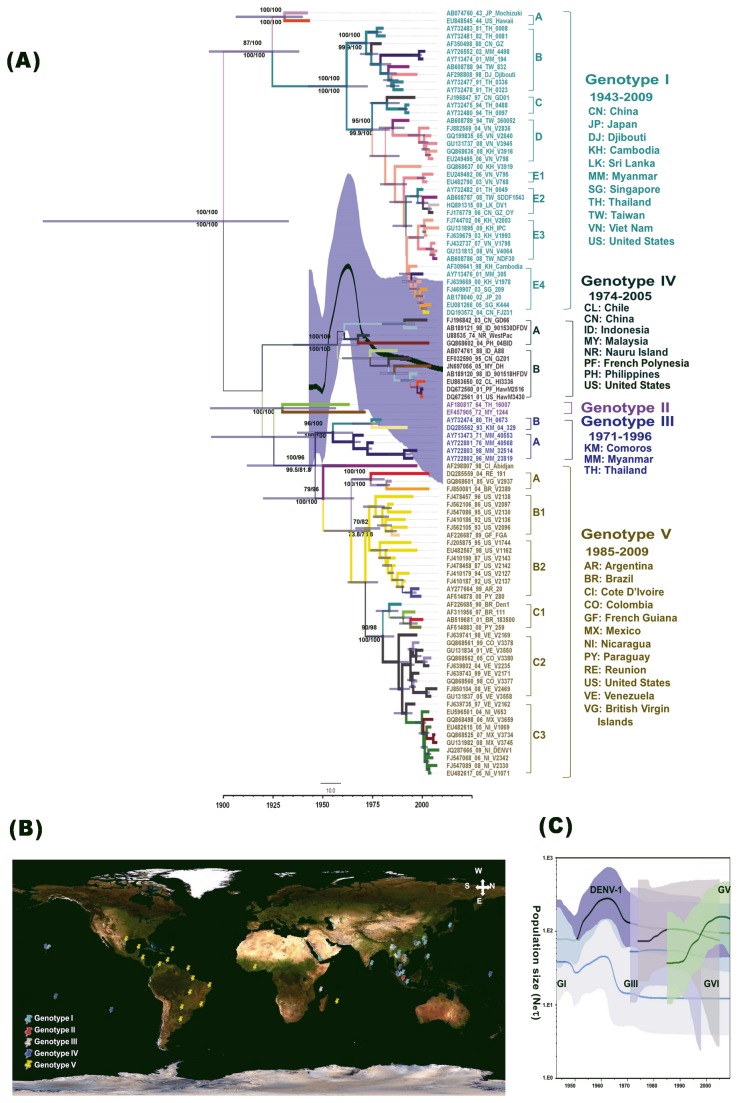
Figure 1. Phylodynamic analysis based on 100 DENV1 genome sequences.
(A) Maximum clade credibility (MCC) tree based on 10316 nt gap-stripped MSA, which was constructed using the BMCMC method with BEAST program. The tree shows the proportional relationship between branch length and time; the dashed line below is the scale bar for genetic distance. Each branch thickness indicates the state probability and is colour coded to indicate the most probable locations. Blue bars at nodes indicate 95% highest probability density (HPD). For major lineages, the bootstrap (BS) values and posterior probability (PP) values for the key nodes are indicated as in BS-NJ/BS-ML above and as in PP-MrBayes/PP-BEAST below. Genotypes and subgenotypes are indicated on the right. The thick solid line indicates the median estimates, and the grey area displays the 95% HPD. (B) Overview of geographic dispersal of DENV-1 obtained by SPREAD software (worldmap available at Central Intelligence Agency). (C) Comparison of Bayesian skyline plot between DENV-1 and each genotype. The x-axis is the time-scale in years, and the y-axis is a logarithmic scale of Neτ (where Ne is the effective population size and τ is the generation time).

