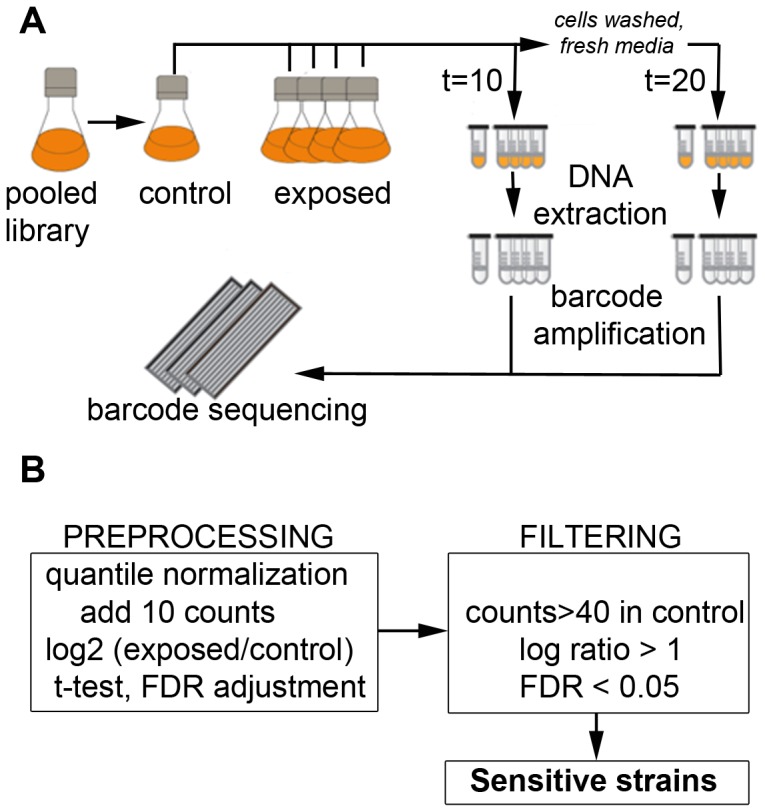
Figure 1. Experimental workflow for barcoded genomic phenotyping.

Schematic representation of A) experimental design (t is the time of cell harvest, which was at 10 or 20 generation times) and B) analysis and filtering of high-throughput sequencing data.
