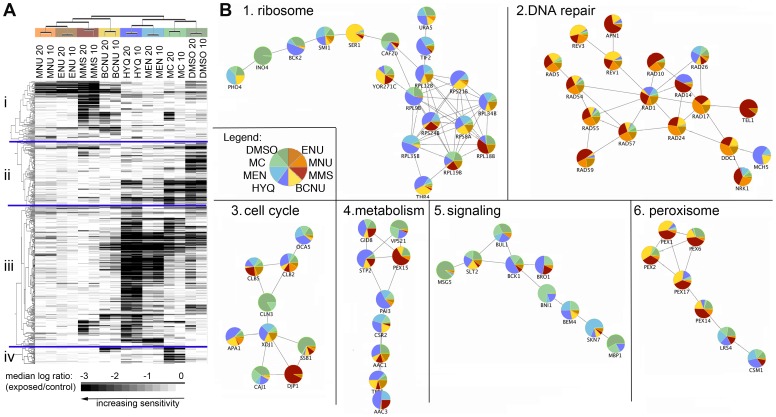
Figure 2. The difference between alkylating and oxidizing agents can be explained by fitness profiles of the strains.
A) Two-dimensional hierarchical clustering of fitness ratio (median log ratio of exposed/control) results using the strains sensitive after 10 and 20 generation times upon exposure to different chemicals. Compounds and doses are plotted across the horizontal axis. On the vertical axis, a subset of 508 strains with reduced fitness is shown. B) Protein-protein interaction networks with >5 toxicity-modulating proteins. The colors (explained in legend, same as labels in A) within the pie charts indicate the contribution of each of the eight compounds. Alkylating agents represented in shades of yellow-red, oxidizing agents in shades of blue and non-genotoxic compounds in green.

