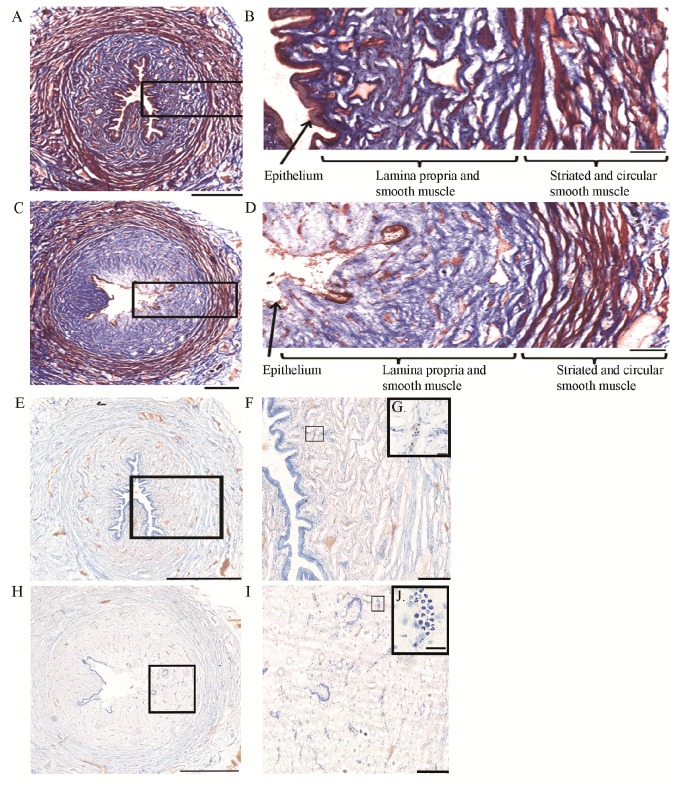
Figure 7. Histological evaluation of urethral tissue.
A-D. Masson’s trichrome examples from a saline (A, B) and 0.5% acetic acid (C, D) infused urethra. Sections shown are from mid part of the urethra.
A. 10x image montage of saline infused urethral tissue. Black box is enlarged in B.
B. 10x image illustrating intact epithelium, lamina propria/smooth muscle.
C. 10x image montage of 0.5% acetic acid infused bladder tissue. Black box is enlarged in D.
D. 10x image illustrating the lack of epithelium and edema in the lamina propria/smooth muscle area.
E–J. Toluidine blue image montage examples from a saline (E–G) and 0.5% acetic acid (H–J) infused urethra.
E. 10x image montage of saline infused urethral tissue. Black box is enlarged in F.
F. 10x image illustrating intact epithelium, lamina propria/smooth muscle.
G. 60x enlargement illustrating a presumed group of neutrophils.
H. 10x image of 0.5% acetic acid infused bladder tissue. Black box is enlarged in I.
I. 40x image illustrating the lack of epithelium, edema and infiltration of presumed neutrophils and other cell types in lamina propria/smooth muscle area. Note the increased number of presumed neutrophils.
J. 60x enlargement illustrating a presumed group of neutrophils. Scale bars are 1000 µm for E, H, 500 µm for A, C, 200 µm for B, D, F, I and 20 µm for G, J
Images in E, H are from adjacent sections of A, C respectively. Data included are from 2 cats with bladder irritation and 2 controls.

