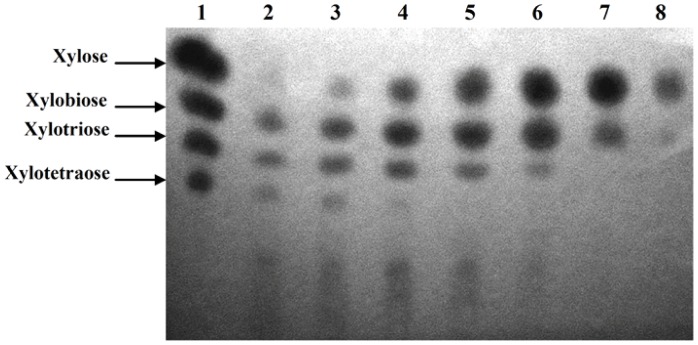
Figure 5. TLC analysis of the hydrolytic products of xylan and xylooligosaccharides by xylanolytic enzymes of L. chartarum SJTU59.
Lane 1, marker of xylose and xylooligosaccharides; Lanes 2 to 8, crude enzyme solution +1% beechwood xylan substrate in 0.1M sodium acetate buffer (pH 5.0) at 50°C for 24 h (Lane 2, 20 µL +980 µL; Lane 3, 30 µL +970 µL; Lane 4, 50 µL +950 µL; Lane 5, 200 µL +800 µL; Lane 6, 300 µL +700 µL; Lane 7, 500 µL +500 µL; Lane 8, 800 µL +200 µL). The composition of hydrolytic products gradually changed with the proportions of enzymes and substrate.

