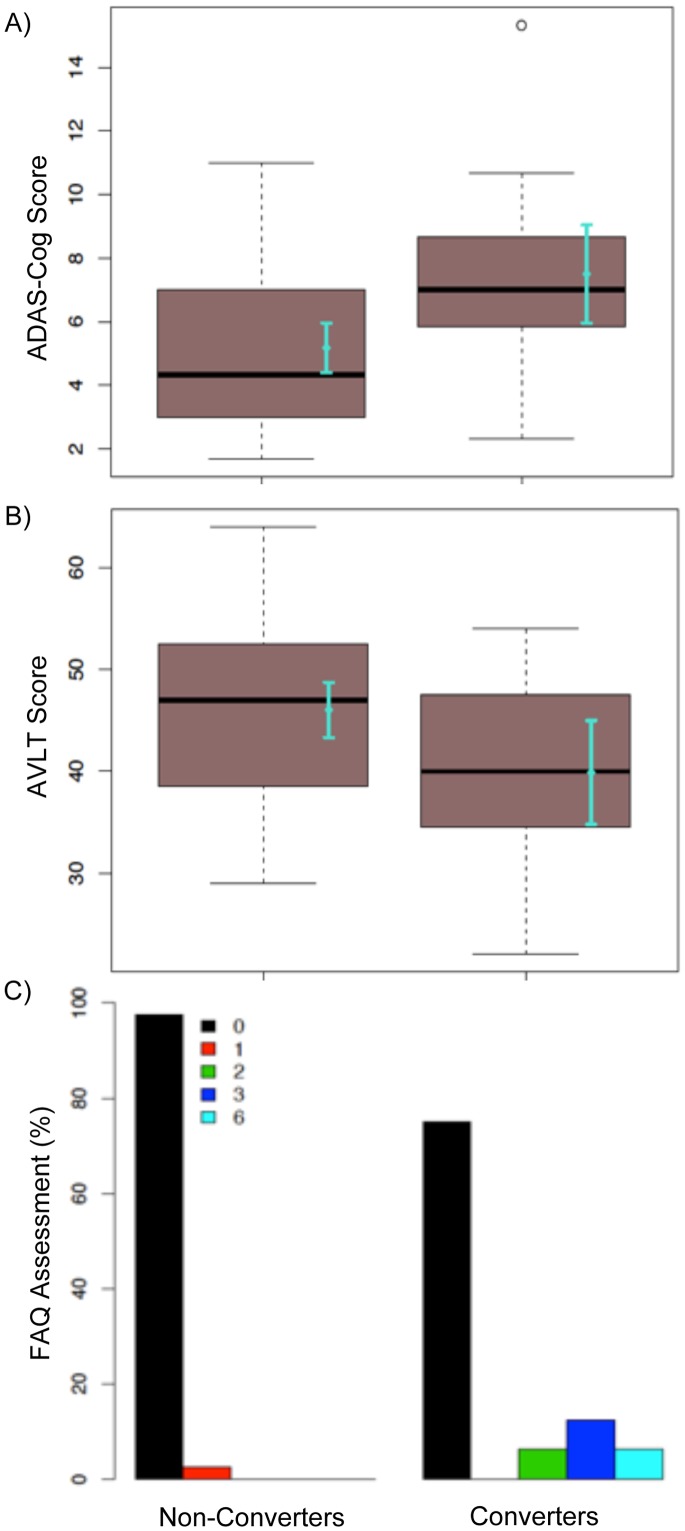
Figure 1. Distribution of scores on clinical assessments for converters and non-converters at baseline visit.
A) Boxplot and mean with 95% CIs showing scores on the ADAS-cognitive test. B) Boxplot and mean with 95% CIs showing scores on the AVLT test. C) Bar graph showing scores on the FAQ assessment.

