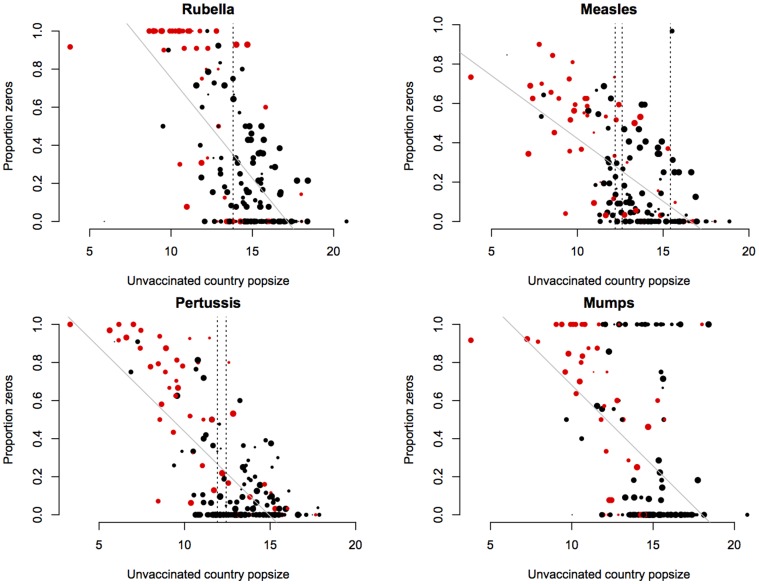
Figure 1. Critical Community Size of four immunizing childhood infections.
The x axis shows the size of unvaccinated proportion of the populations of each country (log scale), the y axis shows the proportion of years where incidence reported to the WHO is greater than zero (years range between 1998 and 2011 for rubella and mumps and 1980 and 2011 for pertussis and measles). Colours indicate island states (red); the size of points indicates the number of years for which there was data. Vertical lines show previously reported CCS values; higher values for measles refers to Niger [10], lower to America and the UK [3], [24]; for pertussis values refer to England and Wales [12]. The grey lines show a fitted linear regression, weighted to reflect sample size for each country (Table 1). The extreme positive outlier for measles (reflecting no years with more than one case at a relatively large population size) is the Democratic People's Republic of Korea. For all infections, islands with no years with no cases reported tend to be islands like the United Kingdom and New Zealand, likely to have highly effective surveillance systems.

