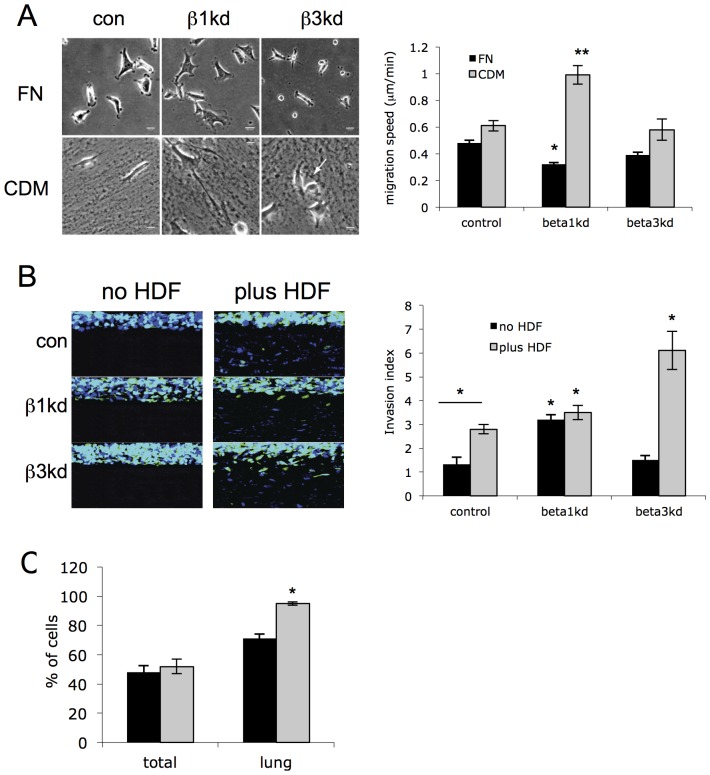
Figure 2. Silencing β3 integrins results in increased fibroblast-dependent cell invasion.
(A) Example phase contrast images from time-lapse movies of specified cells plated on fibronectin or CDM. Graph shows quantification of migration speed from time-lapse movies of cells on specified ECM proteins. Bars are mean speed (μm/min) +/− SEM, n = at least 110 cells over 3 independent experiments. (B) Example fluorescence confocal images of organotypic cultures either containing human dermal fibroblasts (HDF) or not. MDA MB 231 cells are represented in green (blue = DAPI). Scale bars are 50μm. Graph shows quantification of invasion of cells in organotypic cultures. Bars represent mean invasion index +/− SEM from at least 40 different images per cell type over 4 independent experiments. * = p<0.01 throughout compared to equivalent control values. (C) Analysis of metastasis of control or β1kd cells in nude mice. MDA-MB-231 cells were pre-labeled with fluorescent cell trackers and intravenously injected (5×10⁵ green and 5×10⁵ red cells together) into mice. After 48 hours the cells remaining in the vasculature were stained with mouse anti-human HLA-antibody for 5 min. Cells from one lung per mouse were isolated, stained with Alexa-647 secondary antibody and quantified based on fluorescence. Results are expressed as (mean±SEM) percentage of specified cells from all cells isolated (n = 10 mice; *, p = 0.05).

