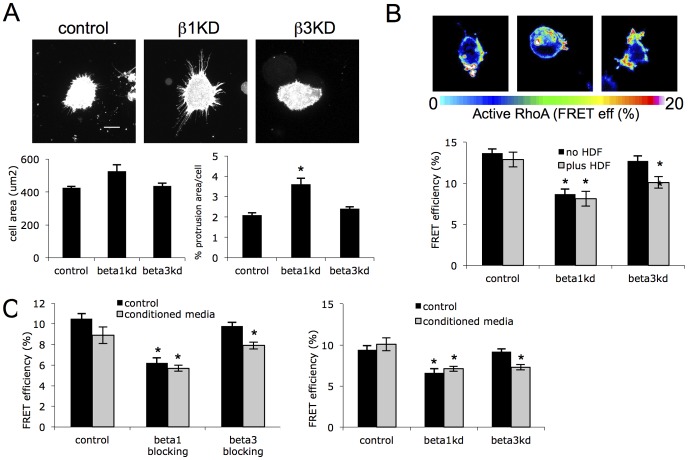
Figure 3. β1 and β3 integrins differentially contribute to RhoA activation during invasion.
(A) Z-projections of >25 confocal z-stack images of specified cells expressing GFP-lifeact embedded in 3D ECM gels. Scale bar is 10 µm. Graphs show mean cell area and % of cell area occupied by membrane protrusions quantified from reconstructed confocal z-stack images of GFP-lifeact cells as shown. At least 35 cells quantified for each, error bars are SEM. * denotes p<0.01. (B) Example images and quantification of FRET analysis of RhoA activation in each cell type. Cells cultured in 3D gels either in presence or absence of human dermal fibroblasts (HDF). Bars show mean FRET efficiency (%) +/−SEM, n = 24 for each over 3 independent experiments. (D) Quantification of RhoA activation using analysis of RhoA FRET biosensor in control cells treated with control or integrin function blocking antibodies (left graph) or integrin knockdown cells plated in 3D gels in the presence of control media or conditioned media from human dermal fibroblasts (HDF). Bars are mean FRET efficiency +/−SEM, n = 30 cells over 3 independent experiments. * = p<0.01.

