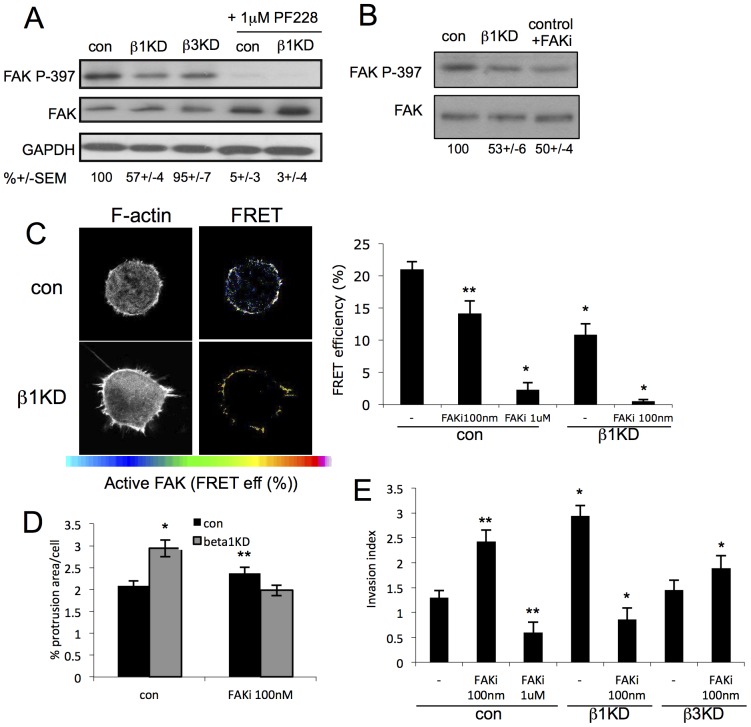
Figure 5. Enhanced invasion in β1-silenced cells is regulated by attenuated FAK activity.
(A) Western blot of lysates from specified cells either untreated or treated with 1 µM PF228 (FAK inhibitor) for 2 hours. Blot is probed for active (P-397) or total FAK. GAPDH serves as a loading control. Numbers below represent average active FAK levels as a % of control as quantified by densitometry from 4 independent experiments +/−SEM. (B) Western blot of lysates from shCon or β1kd cells treated with vehicle control or PF-228 at 100 nM (FAKi) and probed for P-FAK (Y-397) or total FAK. (C) Example images of shCon or β1kd cells expressing FAK FERM FRET biosensor embedded in 3D gels. Images in left panel show F-actin (phalloidin) and right panels show FRET efficiency heatmaps according to pseudocolour scale bar indicated. Graph shows quantification of >30 cells per specified condition. Bars represent mean FRET efficiency+/−SEM across 5 independent experiments. ** = p<0.01, * = p<0.005. (D) Quantification of protrusion area/cell of control or β1kd cells expressing GFP-lifeact and embedded in 3D gels. Cells were treated with DMSO or PF228 at 100 nM prior to analysis. Bars represent mean+/−SEM of 45 cells each over 2 experiments. * = p<0.01 (E) Quantification of invasion of specified cells into 3D gels treated with DMSO (vehicle control) or PF-228 at specified concentrations. Bars represent mean+/−SEM or 35 images across 3 independent experiments. ** = p<0.01, * = p<0.05.

