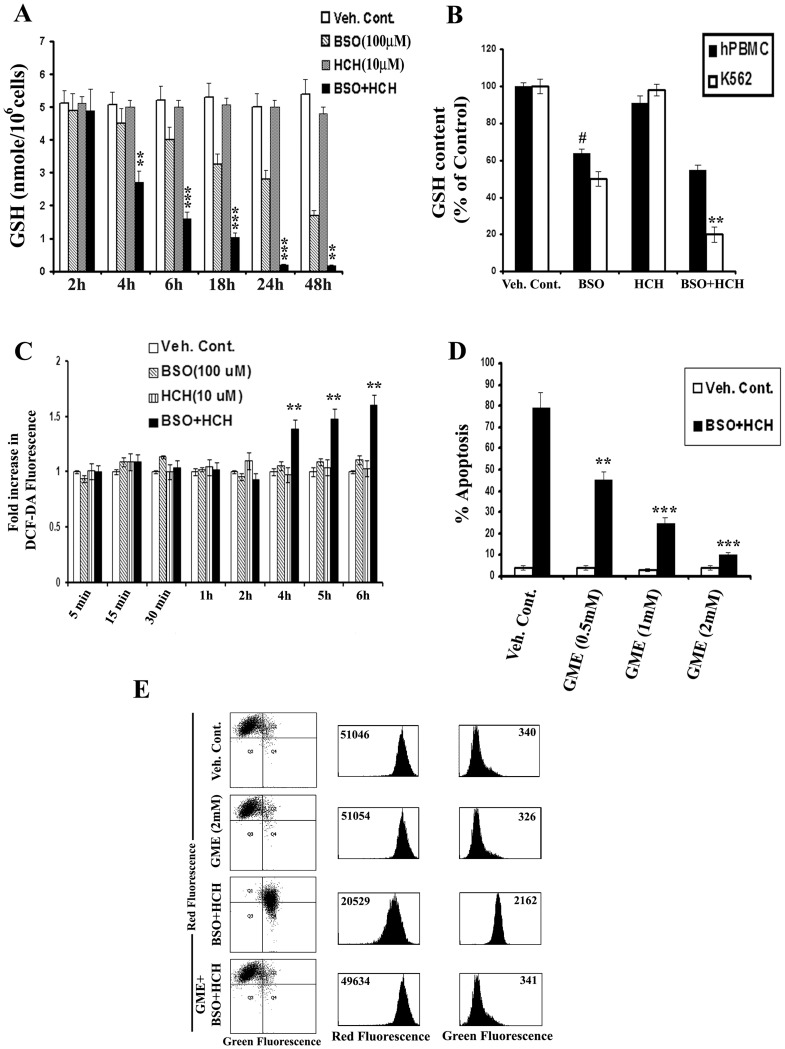
Figure 4. BSO potentiates HCH- induced apoptosis by depleting intracellular GSH.
(A) K562 cells were treated as indicated for measurement of intracellular GSH as described in Materials and Methods. Data represent mean ± SD of three experiments. ** p<0.01 and *** p<0.001compared to treatment with BSO alone. (B) K562 cells and hPBMC were treated as indicated for 24 h and intracellular GSH was measured. Data represent mean ± SD of three experiments. # p<0.01 compared to vehicle control; ** p<0.01 compared to BSO alone. (C) K562 cells were treated as indicated for different time points and intracellular H2O2 were measured by flow cytometry after DCF-DA staining. Data represent mean ± SD of three experiments. ** p<0.01 compared to treatment with BSO or HCH alone. (D) K562 cells were preincubated with varying concentrations of glutathione monoethyle ester (GME) for 1 h and further incubated with BSO (100 µM) and HCH (10 µM) as indicated for 36 h. Percent apoptotic cells were calculated by flow cytometry after annexinV-PI staining. Data represent mean of three experiments. ** p<0.01 compared to treatment in absence of GME. *** p<0.001 compared to treatment in absence of GME. (E) K562 cells were pre-incubated with 2 mM GME for 1 h and further incubated with BSO (100 µM) and HCH (10 µM) in combination for 36 h. Mitochondrial membrane potential was assessed in a flow cytometer after staining with JC-1 dye. Dot plots and histograms are representative of two similar experiments.

