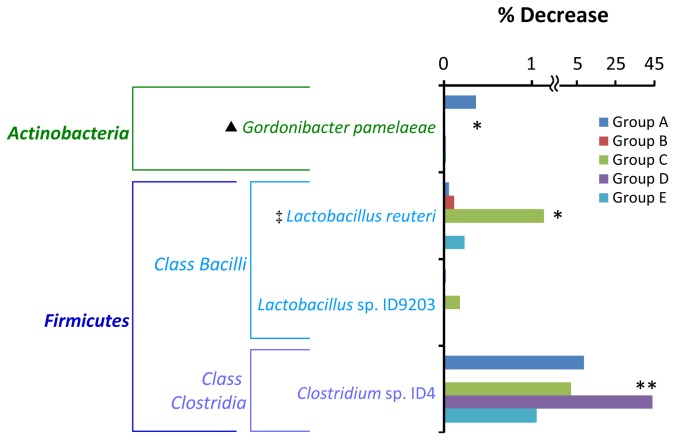
Figure 4. Bacterial phylotypes in the small intestine whose population level decreased upon PG-administration.
Percent decrease was calculated by subtracting the percent population level of each specific phylotype found in the PBS control mice with that found in the PG-administered mice. Associations between bacterial phylotypes and PG administration were examined by Fisher exact test. The phylotypes having P values less than 0.05 at least in 2 groups (see Table S7) are shown. Asterisks * and ** indicate bacterial phylotypes having P values less than 0.05 in 3 and 4 groups, respectively. ‡: Bacteria with immunomodulatory effect, ▲: disease-associated bacteria.

