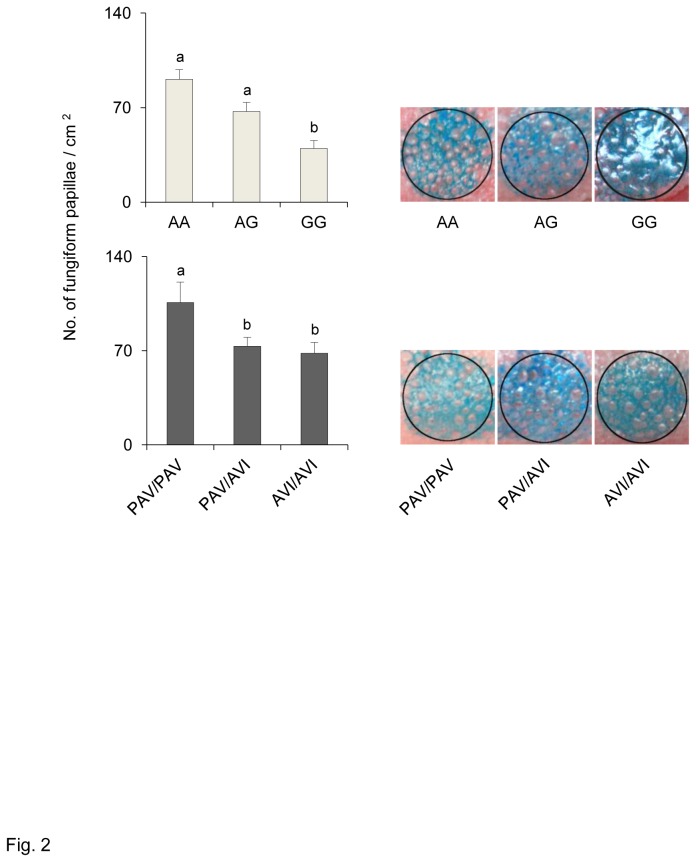
Figure 2. Relationship between density of fungiform papillae and gustin gene and TAS2R38 polymorphisms.
Mean values ± SEM of density of fungiform papillae (No. /cm2) on the anterior part of the tongue of individuals with genotypes AA, AG and GG of gustin (CA6) polymorphism rs2274333 (A/G) (upper graph) and of individuals with genotypes PAV/PAV, PAV/AVI and AVI/AVI of TAS2R38 (lower graph). n=63. Different letters indicate significant difference (p≤0.0379; Newman-Keuls test subsequent to main effects ANOVA). Examples of the 6-mm-diameter stained area of the tongue tip where measures were taken are shown to the right of the graphs.

