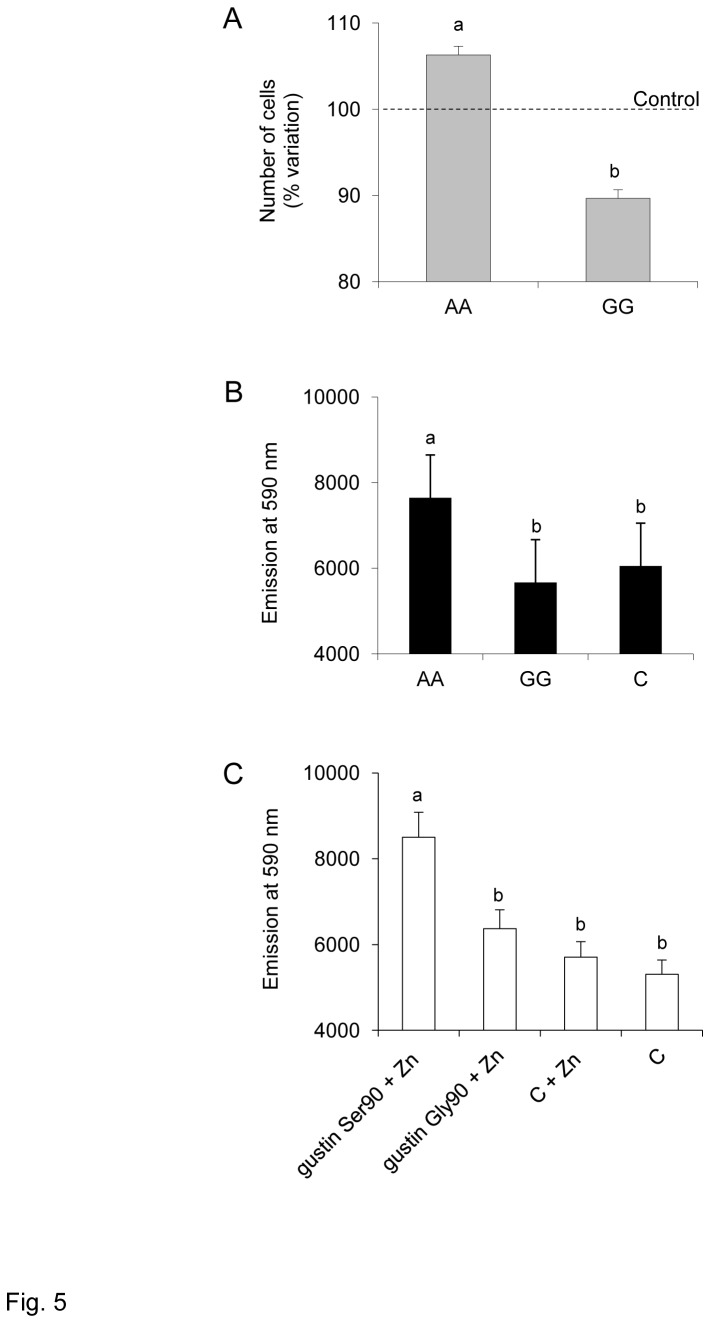
Figure 5. Effect of gustin gene polymorphism rs2274333 (A/G) in vitro experiments.
A, Number of cells, expressed as percentage of control, after treatments with saliva of subjects with genotype AA (n=12) or with saliva of subjects with genotype GG (n=12); different letters indicate significant difference (p=0.0135; Student’s t test). B, Fluorescence emission at a wavelength of 590 nm obtained from cells treated for 72 h with saliva of subjects with genotype AA, genotype GG and control; n=12; different letters indicate significant differences (p≤0.00023; Newman-Keuls test subsequent to one-way ANOVA). C, Fluorescence emission at a wavelength of 590 nm obtained from cells treated for 72 h with the two iso-forms of isolated gustin (gustin Ser90 or gustin Gly90) + Zn, control + Zn, or control; n=33; different letters indicate significant differences (p≤0.00067; Newman-Keuls test subsequent to one-way ANOVA).

