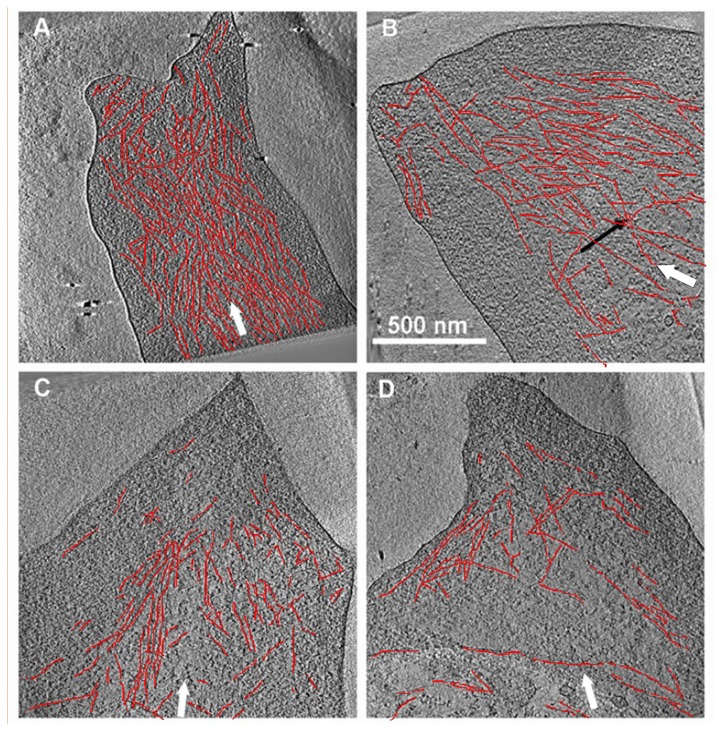
Figure 4. Cryo-electron tomography of cells incubated with Y-27632.
REF52 cells expressing YFP-paxillin growing on EM grids, untreated (A) or treated for 3 (B), 10 (C) or 30 (D) minutes with Y-27632, were analyzed by correlative (fluorescence-cryo-electron tomography) microscopy. Individual FAs, identified by light microscopy, were subjected to cryo-ET and 3D image reconstruction. The major axis of each FA is indicated by a white arrow; some of the more prominent filaments are highlighted by a thin red line. Ten nm-thick slices through the cryo-tomograms of representative FAs indicated a major reduction in actin alignment, already observed following 3 min treatment with the drug (compare B to A: The black arrow, in B, points to an example of misaligned filaments, commonly seen after Y-27632 treatment). Upon longer treatment with Y-27632, progressive misalignment of actin filaments is apparent, accompanied by a marked reduction in filament density. The scale bar in B represents 500 nm.

