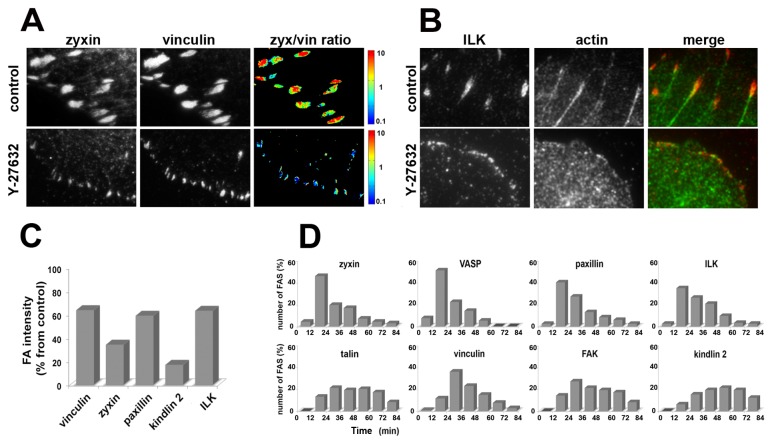
Figure 5. Peripheral FAs in Y-27632 treated cells differ from control FAs in molecular composition and lifespan.
(A) Comparison of zyxin and vinculin fluorescence intensity for FAs in untreated cells, and peripheral FAs in Y-27632 treated cells. Cells prior to and following 60 min of Y-27632 treatment were double-labeled for zyxin (left) and vinculin (center). Right: The fluorescence ratio image (zyxin/vinculin) in a logarithmic, blue-to-red spectrum scale, representing the ratio value. (B) Comparison of ILK and actin localization in FAs of untreated cells, and in peripheral FAs of Y-27632 treated cells. Two-color TIRF microscopy of the cells prior to and following 60 min of Y-27632 treatment was used to assess for ILK (left) and actin staining (center). Right: A merged image (ILK in red and actin in green), demonstrating enrichment of actin in the FA sites. (C) Normalized vinculin, zyxin, paxillin, kindlin-2 and ILK fluorescence intensities in peripheral FAs following 60 min of Y-27632 treatment, expressed as a percentage of intensity of the same protein in FAs of untreated cells. Fluorescence intensity measurements were averaged over 150 individual FAs. (D) Lifespan of peripheral FAs for each protein, expressed as the percentage of total FA number over time, averaged over 150 individual FAs for each protein.

