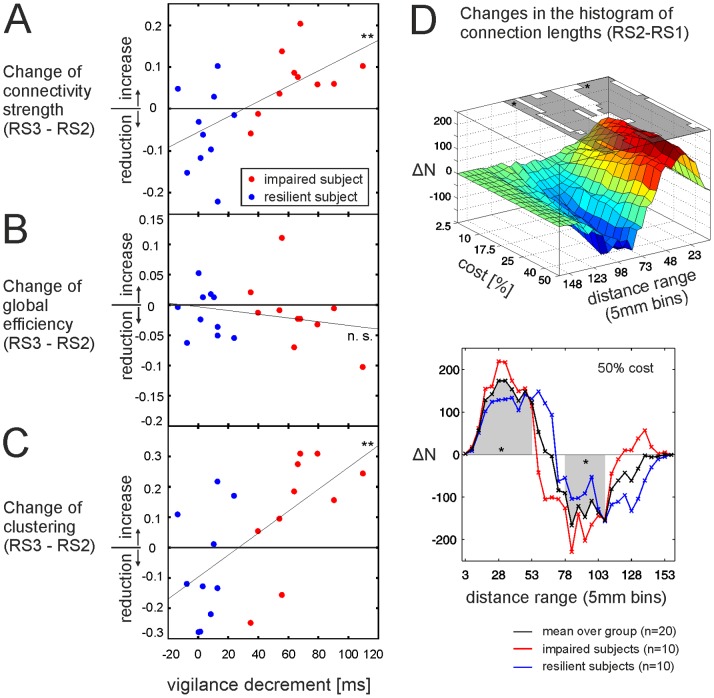
Figure 5. Changes in connectivity strength and network topology during the post-task resting state period (RS2 vs. RS3) and relation with behavioural performance; Changes in the histogram of physical distances.
(A–C) Correlation between post-task changes (RS3-RS2) and individual performance. (A) Connectivity strength: More attentional resilient subjects (blue, subjects with low vigilance decrements) show a reduction in connectivity strength from RS2 to RS3, whereas impaired subjects (red) show a further increase. (B) Changes in global efficiency from RS2 to RS3 did not correlate with performance. (C) Changes in clustering during the post-task phase significantly correlated with individual performance. Resilient subjects (blue) show decreases in clustering from RS2 to RS3, impaired subjects (red) further increase in clustering. (D) Change in histogram of mean distances between nodes following task performance (RS1 vs. RS2): The number of connections were counted in 32 distance bins of 5 mm (ΔN: differences in the number of connections). Top: Following task performance the number of short distances significantly increased and the number of longer distance connections significantly decreased at all cost levels. Significance is indicated by the grey patches at the top of the figure (see File S2 for a 2D version of this plot). Note that graphs at higher cost levels comprise the edges from graphs at lower cost levels which lead to larger differences in the number of connections at higher cost levels (ΔN). Bottom: Distance changes at 50% cost level: impaired subjects (red) showed a more pronounced (but not significant) shift towards shorter connections following the task as compared to more resilient subjects (blue).

