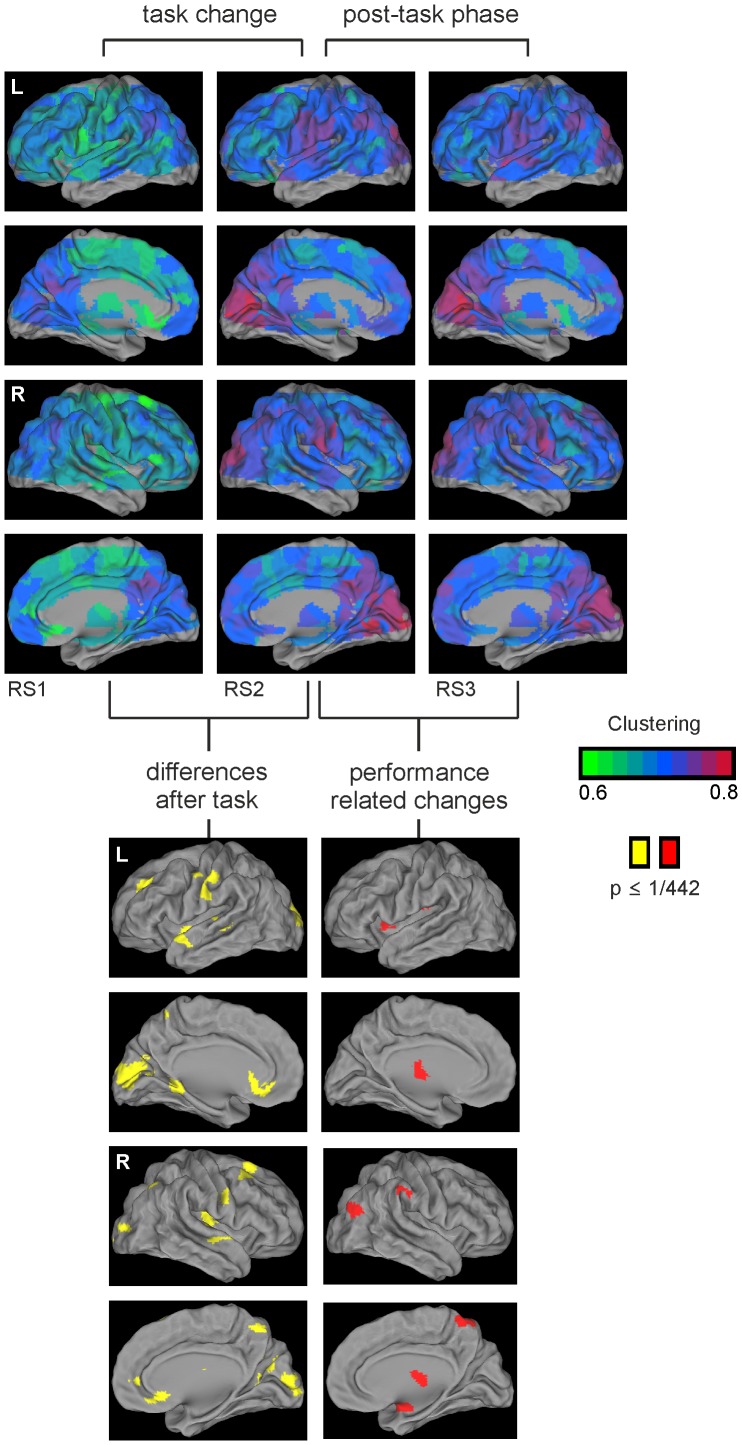
Figure 6. Changes in nodal network clustering over resting state fMRI periods.
Top: Clustering changed over the three resting state fMRI periods. Following task performance all brain regions show higher clustering or cliquishness. Bottom left: Significantly different changes in clustering at nodal level (yellow) were evident among others in visual cortex and basal forebrain; brain areas involved in the processing of visual sustained attention tasks. Bottom right: Significant changes in clustering in the post-task phase that were related to vigilance decline were found among others in the thalamus (red).

