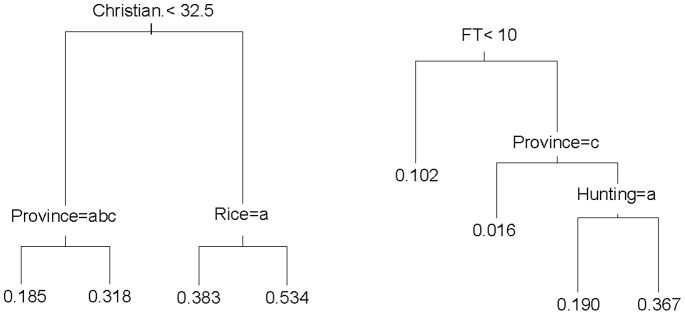
Figure 4. Regression trees for Direct economic uses and Other forest uses, based on CART analyses.

(a) Direct economic uses. (b) Other forest uses. Each classification shows the value or threshold for taking the branch on the left side of the split below it. Values at the tips of the trees indicate the mean value of the index for that group of responses. The classifications are: Christian (% Christians in the village), Province (a = Central Kalimantan, b = East Kalimantan, c = Sabah, d = West Kalimantan), Rice and Hunting (a = no, b = yes as a predominant activity of the village), FT (index of time spent in forest); Population (population of the village).
