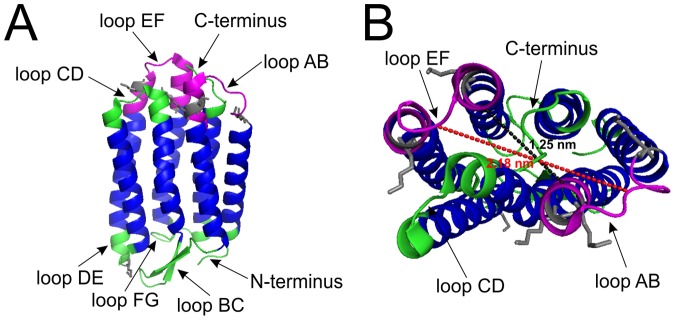
Figure 7. Crystal structure of bacteriorhodopsin (PDB accession number 1IW6).

A shows a side view of bR and B a view from above. Transmembrane regions are shown in blue and extramembranous regions are shown in green and purple. Putative binding sites for the phage clones 43, 68 and 165 are highlighted in purple. Dotted lines indicate distances between residues of the loops AB and EF: black dotted line between the Cα of the residues A38 and V167 (1.25 nm) and red dotted line between the Cα of the residues V34 and M163 (2.18 nm). Lysine residues including their side chains are marked in grey. Structure visualization of bR was done with pymol.
