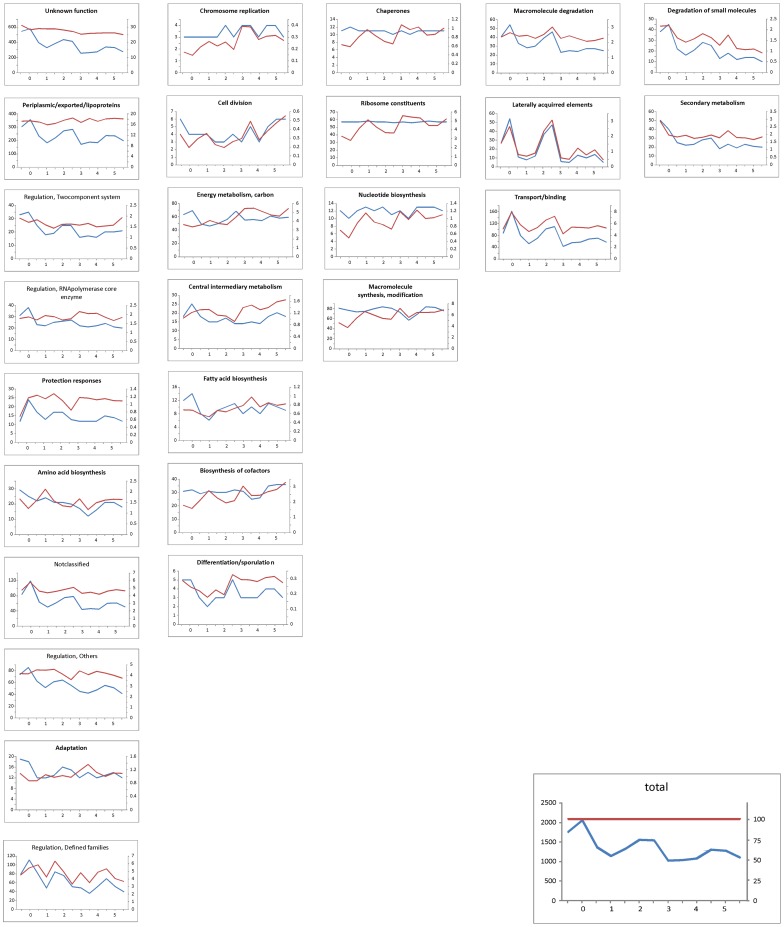
Figure 5. The number of expressed genes of different functional groups over the course of germination.
Blue curve (left vertical axis) – absolute numbers of expressed genes at a given time point, red curve (right vertical axis) – number of expressed genes relative to all of the expressed genes, in terms of the percent. Horizontal axis – time [hours]. Individual functional groups are ordered in columns according to the similarity of the profiles.

