
Figure 1. SLEDAI values according with answer given to PASS question.
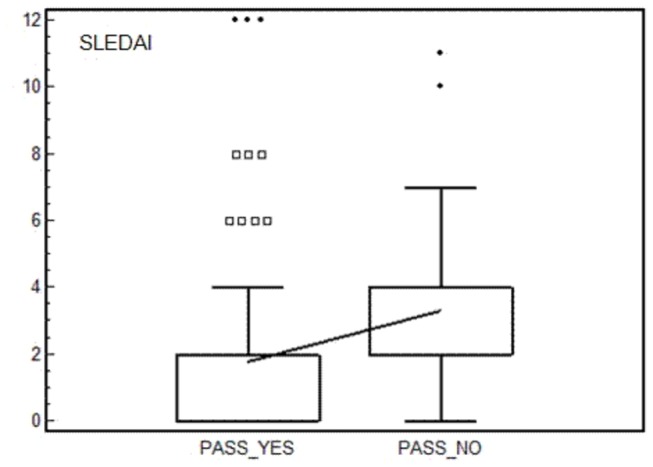
Box and whiskers plot (median, quartiles, range and possible extreme values).
Official websites use .gov
A
.gov website belongs to an official
government organization in the United States.
Secure .gov websites use HTTPS
A lock (
) or https:// means you've safely
connected to the .gov website. Share sensitive
information only on official, secure websites.
Box and whiskers plot (median, quartiles, range and possible extreme values).