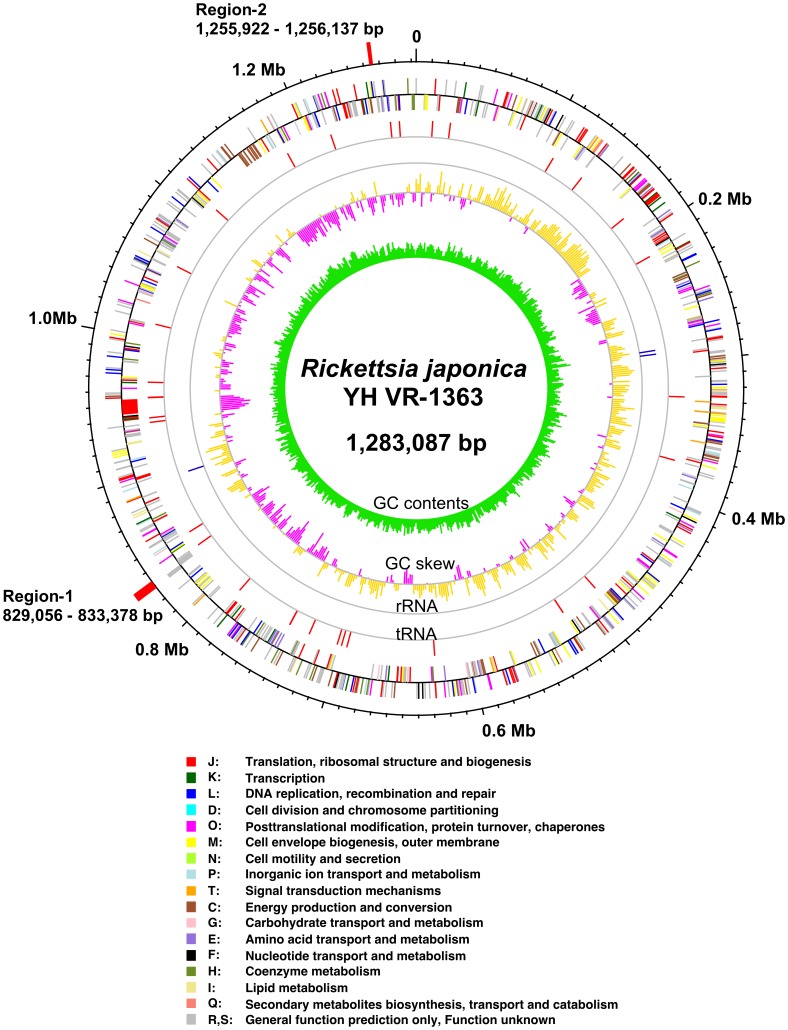
Figure 1. Circular exhibition of the Rickettsia japonica YH genome.
The outermost scale is marked for nucleic acid position in Mbp, and Region-1 and -2 (red). From the outside (track 1), gene positions and directions (clockwise on the outside and anti-clockwise on the inside) of each gene were classified and colored based on COGs [45]. Track 2 and 3: tRNA (red) and rRNA (blue), respectively. Track 4: GC skew, outside yellow and inside purple indicate values >0 and values <0 as calculated by (G−C/G+C) [46]. Track 5: innermost, GC contents. Based on the cumulus of the GC skew values, accompanied by other Richettsia genomes, a hypothetical origin, shown as ori, was determined and the base numbers were counted from the origin.

