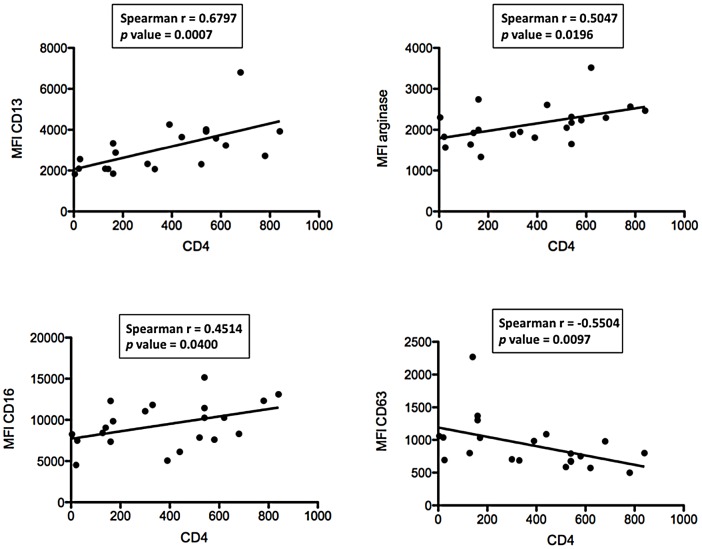
Figure 2. Correlation between CD4+ T cells and phenotypic markers.
NDGs were isolated from the blood of HIV+ patients (n = 21) as described in materials and methods and the expression levels of phenotypic markers were determined by flow cytometry. Correlation between CD4+ T cell counts and phenotypic markers was determined by a Spearman's rank test.

