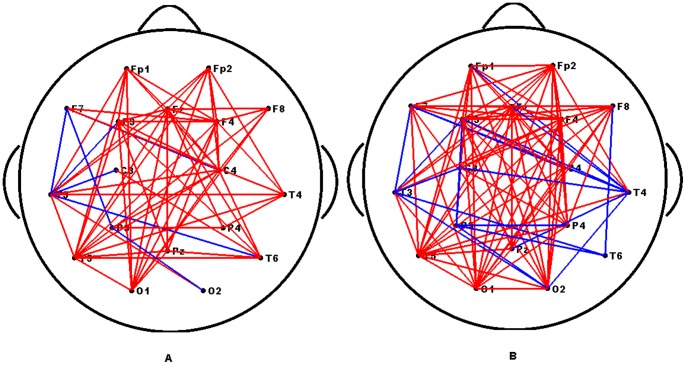
Figure 7. Nodal connection differences of networks of the subject from Group 1 and Group 2.
(A) 12.5 Hz, (B) 16.6 Hz. The red and blue lines indicate the nodal connection weights in the networks of Group 1 show significantly increased and decreased compared with those of Group 2, respectively. The results were produced using permutation testing, p<0.05.

