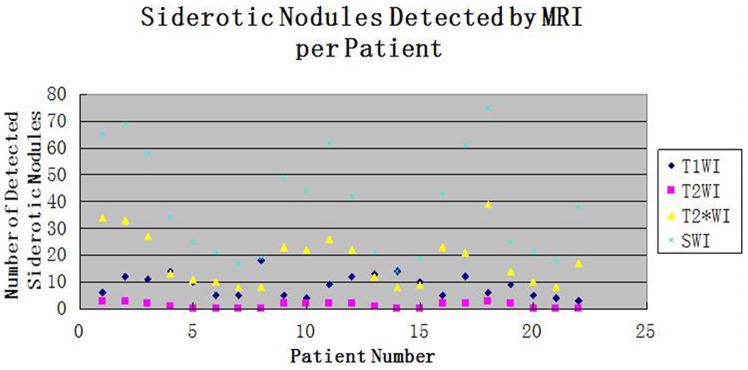
Figure 1. A plot of the number of siderotic nodules detected by MRI in each patient.

The horizontal axis indicates the patient number, and the vertical axis indicates the number of siderotic nodules. Black rhombus, red squares, yellow triangles and blue star represent T1-weighted imaging, T2-weighted imaging, T2*-weighted imaging, and susceptibility-weighted imaging, respectively.
