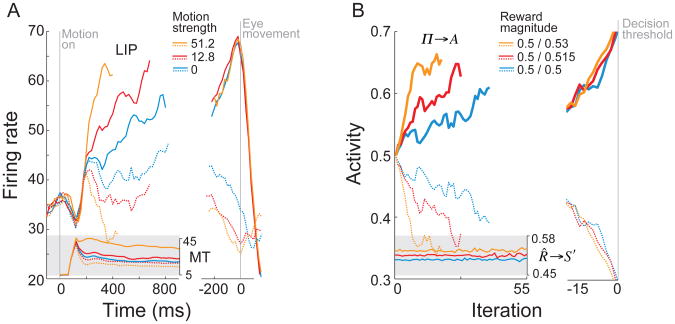
Figure 12.
A. Representative findings from LIP and MT during motion discrimination, from Gold and Shadlen (2007, p. 548). B. Results from Simulation 3.4. Upgoing data-series in the main panel are for the unit representing the chosen policy, downgoing time-series for the unchosen policy. As in Panel A, red and yellow data-series are based only on trials involving correct (reward-maximizing) responses.

