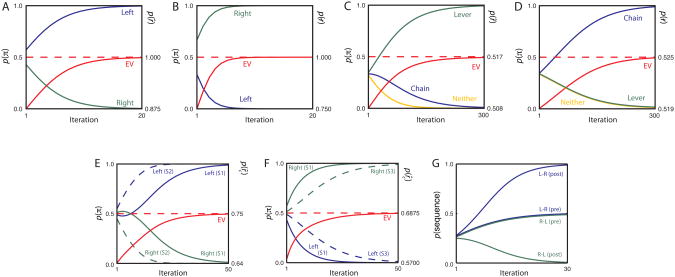
Figure 6.
Results of Simulations 1.1 (Panel A), 1.3 (B), 1.4 (C-D), 2.1 (E), 2.2 (F), and 2.3 (G). Blue green and yellow traces indicate the posterior probability of indicated actions/policies at each processing iteration. Red traces indicate the probability p(r̂=1) given the mixture of policies at each iteration, proportional to the expected reward for that mixture. Dashed red lines indicate p(r̂=1) for the optimal policy. In panel G, the two most central data series are offset for legibility; the values were in fact precisely equal across the two. pre, pre-devaluation. post, post-devaluation.

