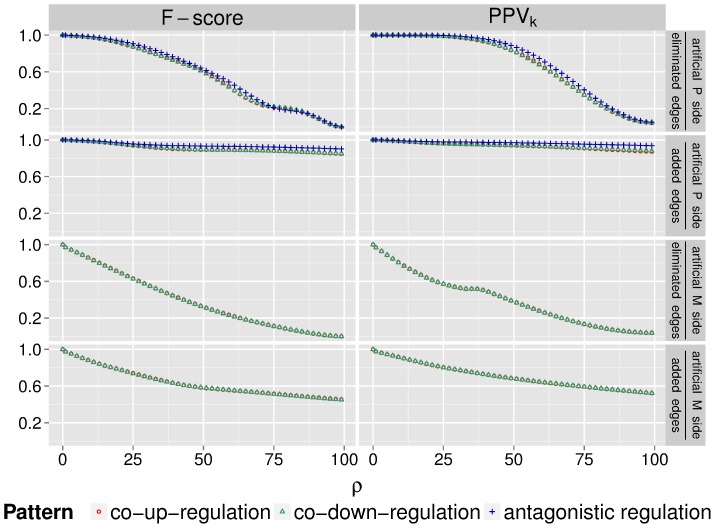
Figure 6.
F-score and PPV evaluating the performance of the SICORE algorithm on artificial data sets for increasing noise levels
  .
.
Results are shown for eliminated and added edges when projecting onto the artificial protein and the artificial miRNA side. Red data points represent the performance of predicting co-up-regulation, green data points refer to co-down-regulation, and blue ones to antagonistic co-regulation.

