
Figure 3. Quantitative Structure-Activity Relationship (QSAR) Modeling and DSB Pharmacophore Definition.
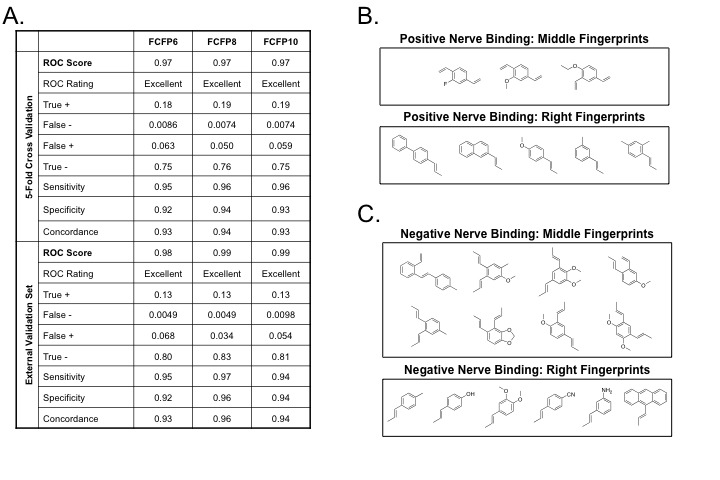
(A) The performance of the QSAR model using the purified ex vivo nerve-specific fluorescence assay are demonstrated with three differing fingerprint types. The model descriptors are averages over 5 runs of 5-fold cross-validation on the training dataset and testing on the external test set. The Receiver Operator Characteristic (ROC) curve analysis was used to assess model performance. The ROC score represents the area under the ROC curve, which defines the fraction of true positive and false positive compounds. ROC scores range from 0.5 to 1.0, where 1.0 shows perfect model selectivity and a score of 0.5 corresponds to random classification. The QSAR models are rated as “fair” if the ROC score is between 0.7 to 0.8, “good” if the ROC score is between 0.8 to 0.9, and “excellent” if the ROC score is above 0.9. Additional properties characterizing the model are sensitivity, specificity, and concordance defined as a function of the number of true positives (TP), true negatives (TN), false positives (FP), and false negatives (FN) as follows: sensitivity = TP/(TP + FN), specificity = TN/(TN + FP), and concordance = (TP + TN)/(TP + TN + FP + FN). The most relevant fingerprints from the QSAR model for both the middle and right rings predicted to (B) positively and (C) negatively influence nerve-specific fluorescence intensity.