
Figure 4. In Vivo Biodistribution and Nerve-Specific Partitioning.
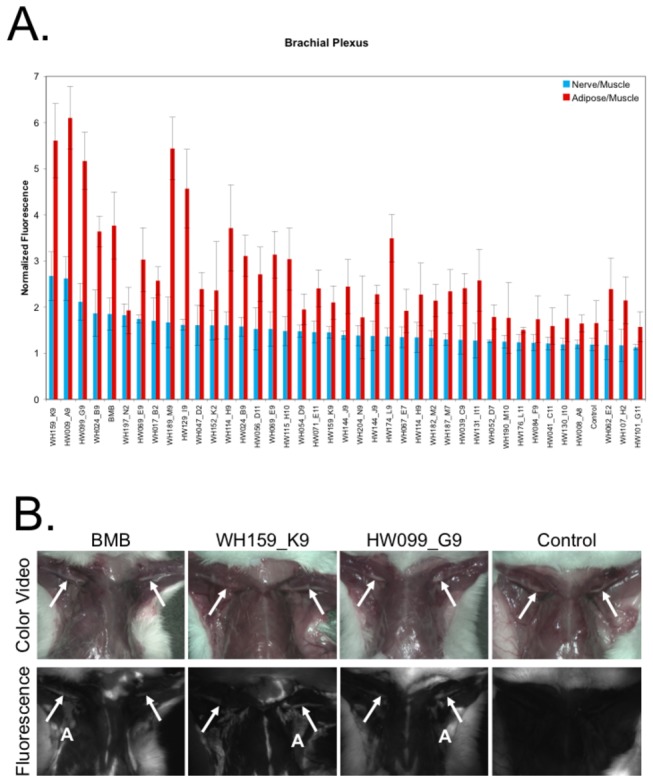
All purified compounds positive by ex vivo nerve-specific screening were screened in vivo in mice. The (A) brachial plexus nerve was quantified using region of interest analysis for n=3 mice per compound. The average nerve to muscle (N/M) and adipose to muscle (A/M) fluorescence ratios normalized to the exposure time of the image were calculated. The error bars represent standard deviation calculated over the 3 animals for n=6 brachial plexus nerves. (B) Representative images of the brachial plexus for the 2 new compounds with highest N/M ratio (WH159_K9 and HW099_G9) are shown compared to BMB and vehicle injected control autofluorescence. The arrows point to the brachial plexus in all images, except the control autofluorescence image where the brachial plexus is not visible. Representative adipose tissue is denoted in each fluorophore injected mouse with an ‘A’.