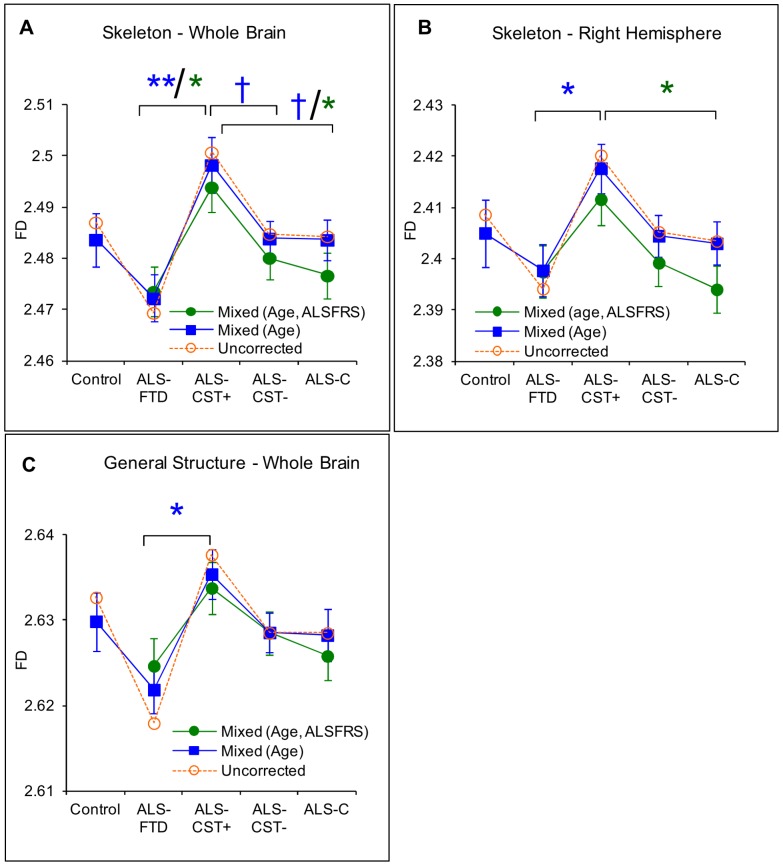
Figure 1. Between group comparison showing significant difference.
Uncorrected means are shown in dashed line and corrected means (mixed model) and standard error of the mean are shown in solid line. Data in blue are for the mixed model with gender, age as covariates and in green with gender, age and ALSFRS-R as covariates. Corrected mean comparison between groups was performed using the Tukey multiple comparison method. † p<0.1,* p<0.05, ** p<0.001 (A) skeleton-whole brain, (B) skeleton right hemisphere, and (C) general structure whole brain.

