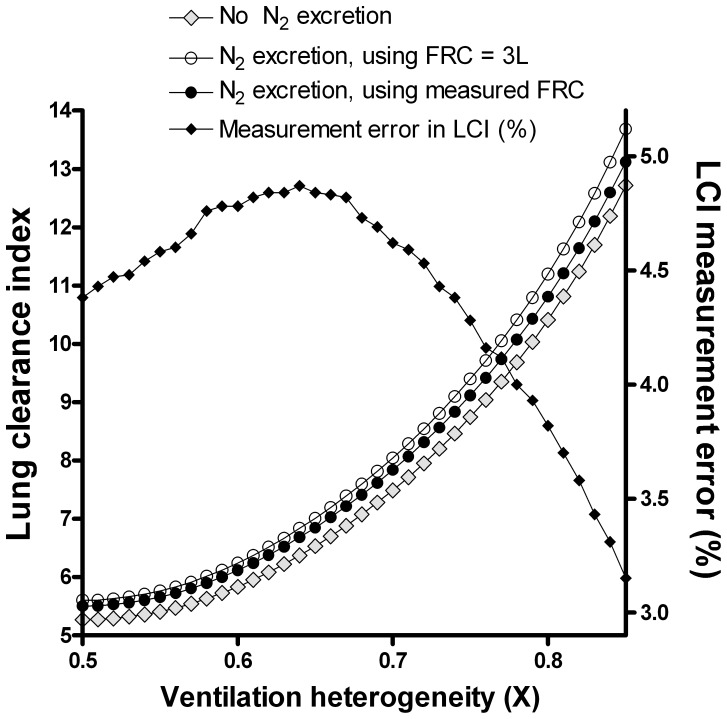
Figure 6. Impact of nitrogen excretion and increasing ventilation heterogeneity on lung clearance index.
The impact of increasing X on LCI is shown by the lower curve (grey diamonds). The impact of nitrogen (N2) excretion on measured LCI is shown by the open circles. The error is partially offset for by the additional error in FRC (black circles). The percentage error in LCI caused by nitrogen excretion is shown by the black diamonds (right axis).

