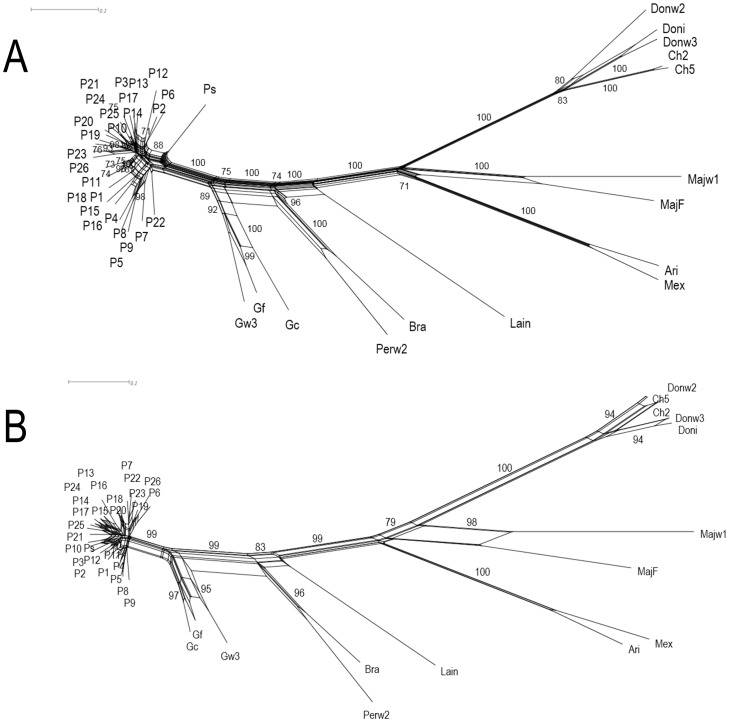
Figure 1. Split graph showing the results of Neighbor-Net analysis obtained on Jaccard distances among Leishmania species tested.
Specimen names according to Table 1. Bootstrap values over 70% are shown. Panel A: split graph generated using the concatenated matrix (fit: 96%). Panel B: split graph generated using matrix corresponding to selective primer V9 (fit: 97%).

