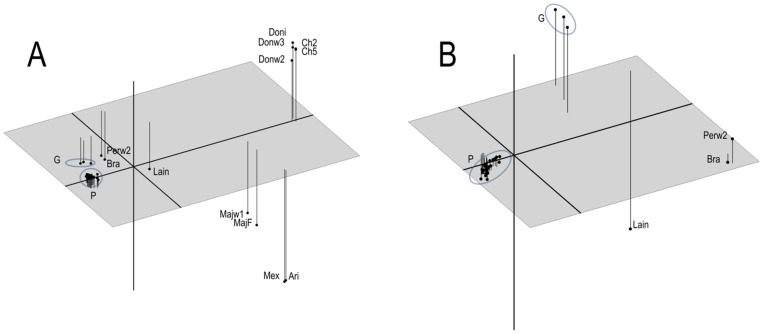
Figure 2. Principal coordinate analysis (PCoA) plots depicting genetic relationships among Leishmania species tested.
Panel A: PCoA plot including all specimens tested. P, L. panamensis strains; G, L. guyanensis strains. Other specimen names according to Table 1. The variance explained is 64%. Panel B: PCoA plot including only species from Leishmania (Viannia) subgenus. The variance explained is 63%.

