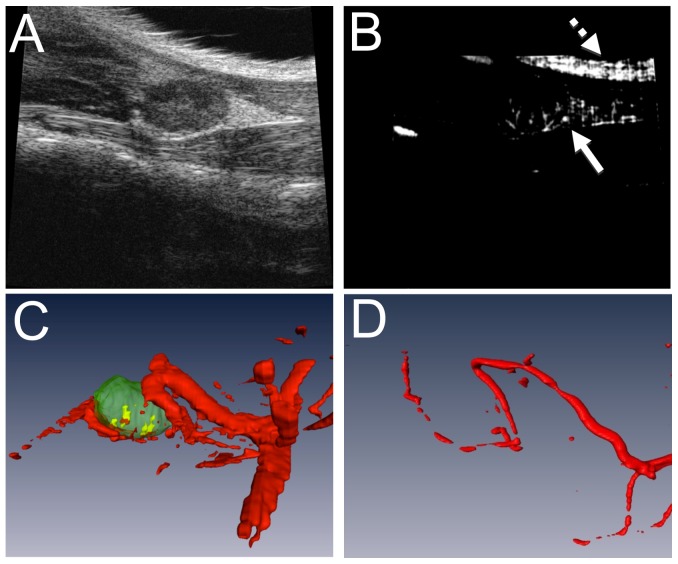
Figure 2. Quantification of normalized power Doppler volume (NPDV) using PD-US and validation with vascular micro-CT.
Data from a representative 4-month-old TNF-Tg mouse is shown. PD-US was performed as described in Materials and Methods to generate the 2D images obtained using B mode (A) and PD (B) scans of the ROI of the knee including the fatpad in which the PLN resides. Note the artifact in the PD recording due to the surface of the skin (dashed arrow in B) versus the true PD signal (solid arrow in B). Images were then imported in Amira where the LN was manually segmented and the PD signal was thresholded to create 3D volumes. The PLNvol (green structure in C) was used to apply a mask to the total blood volume (red structures in C) to give the total PD volume within the LN (yellow structure in C). To confirm this methodology, the mouse underwent Microfil perfusion for vascular micro-CT analysis, and the 3D volume reconstruction is shown (D). Note the similarities in vessel structure with decreased vessel diameter due to live in vivo imaging vs perfusion.

