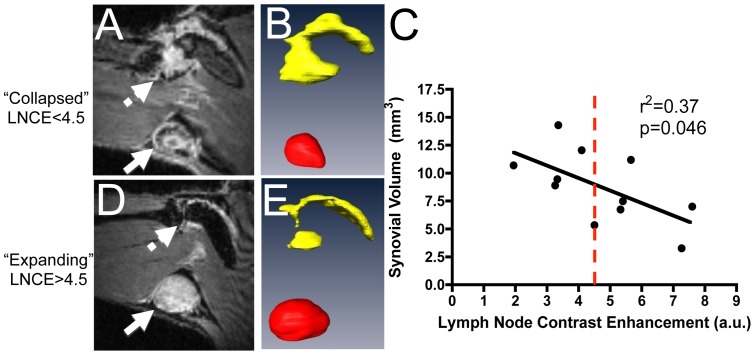
Figure 3. Lymph node contrast enhancement (LNCE) correlates with synovial volume and can be used to phenotype TNF-Tg mice.
TNF-Tg mice (ages 6–12 months) underwent CE-MRI. Mice with a low LNCE (solid arrow) show a large synovial volume (dashed arrow) (A), while PLN with higher LNCE (solid arrow in B) correlate with less synovial volume (dashed arrow in D). PLN (red) and synovial volume (yellow) renditions were completed in Amira from the CE-MRI images, and are shown in B and E. Note the significant correlation between synovial volume and LNCE (n = 11) (C). From these data, a threshold of 4.5 was established to phenotype the PLN of TNF-Tg mice (red dashed line); a LNCE above 4.5 defines PLN as “expanding”, while PLN falling below the 4.5 threshold are phenotyped as “collapsed”.

