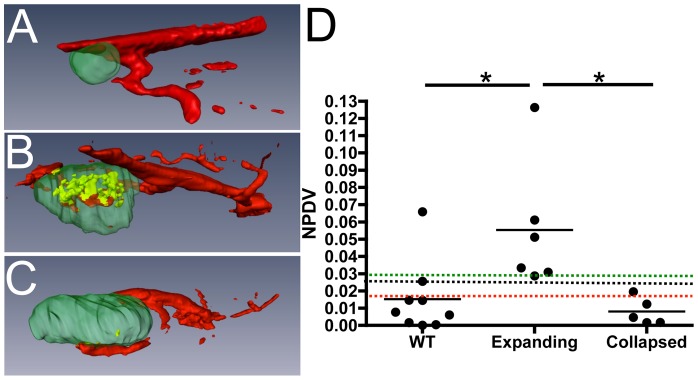
Figure 6. Normalized power Doppler volume is increased in expanding PLN but not in collapsed PLN.
TNF-Tg and their WT littermates mice (ages 3–9 months) underwent PD-US scans and analysis as described in Figure 2. Representative 3D reconstructed images of WT (A), expanding (B), and collapsed (C) PLN (green) with their adjacent vasculature (red) are shown. The PD signal within the PLN is shown in yellow. Note the dramatic decrease in power Doppler volume (blood flow) within the collapsed PLN (B vs. C). The NPDV data are graphed to illustrate two methods that can be used to phenotype expanding vs. collapsed PLN. The first is by a strict threshold (black line, 0.025). The second is to phenotype based on percentiles; PLN falling above the 25% percentile (green line, 0.0298) are expanding, while PLN that fall below the 75% percentile are collapsed (red line, 0.01596) (n>5; *p<0.05 by Kruskal-Wallis ANVOA with Dunn's post test).

