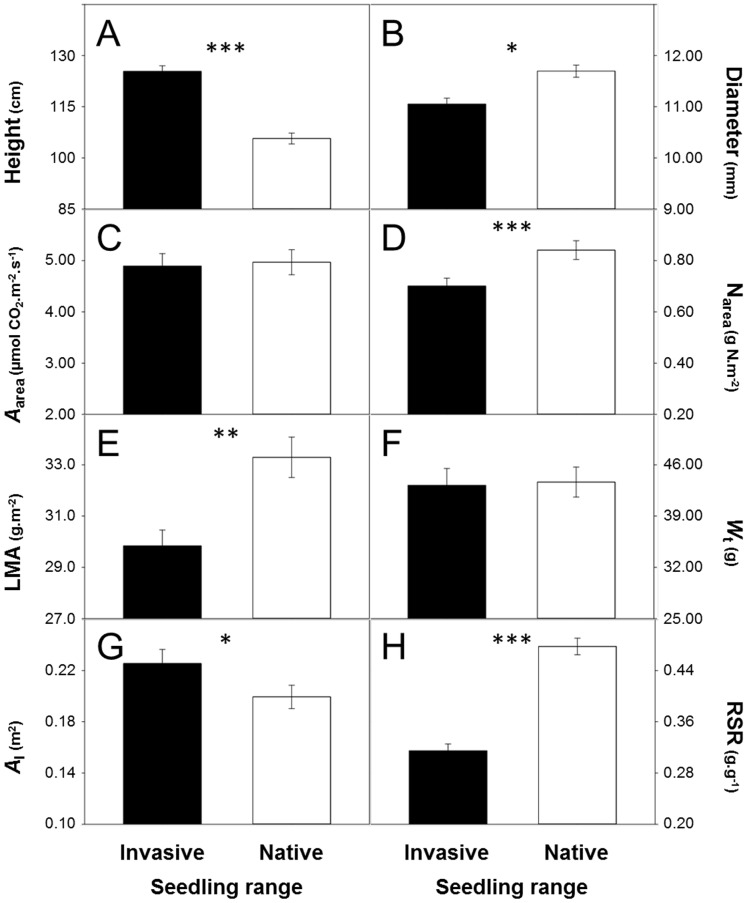
Figure 1. Mean ± SE of life-history traits for native and invasive seedlings of Acer negundo.
Differences in growth (A,B), physiology (C,D), leaf morphology (E), biomass (F,G) and biomass allocation (H) were calculated across nutrient levels. n = 576 (height and diameter), 96 (A area) and 144 (Narea, LMA, W t and A l) per range. See text for definition of terms. * P<0.05, ** P<0.01, *** P<0.001.

