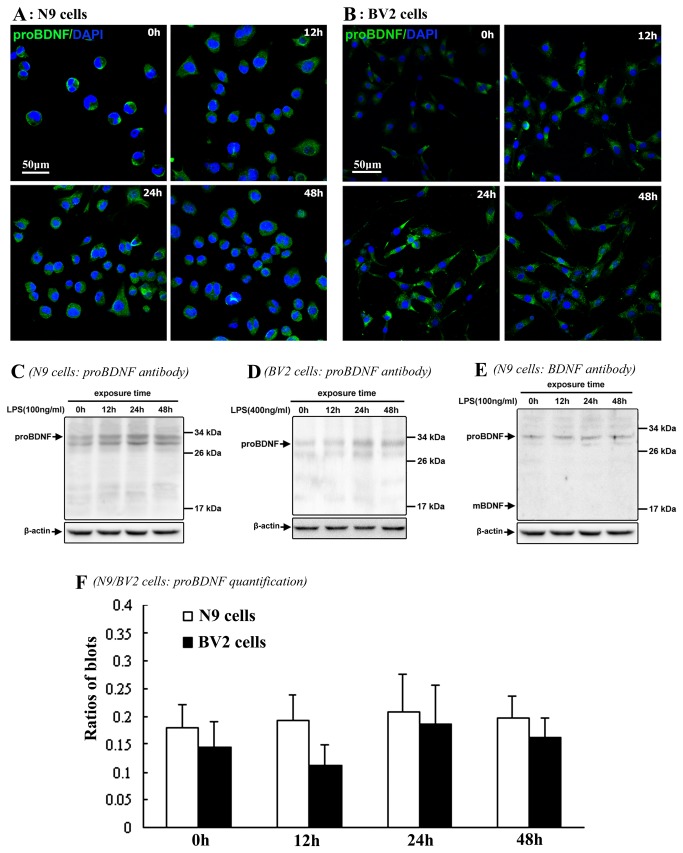
Figure 4. Expression patterns of proBDNF in N9/BV2 cells in both control and LPS exposure groups.
Immunofluorescence shows proBDNF localization in N9 cells (A) and BV2 cells (B). Western blot shows proBDNF in N9 cells by proBDNF antibody (C), BV2 cells by proBDNF antibody (D), and N9 cells by BDNF antibody (E). Comparison of proBDNF expression levels shows no significant difference among distinct N9/BV2 cell groups (F).

