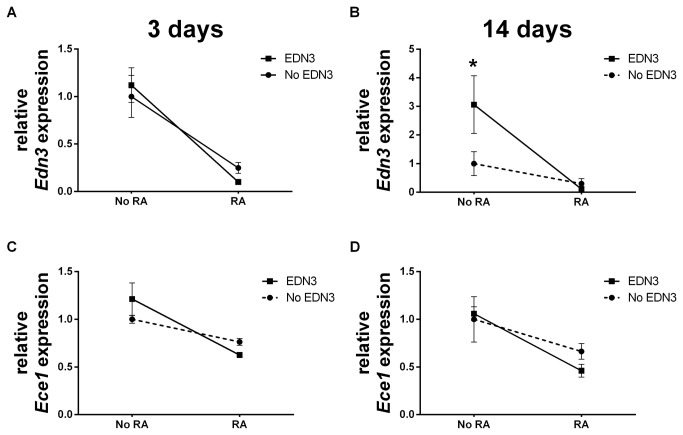
Figure 3. RA decreases EDN3 and Ece1 mRNA levels, depending on whether exogenous EDN3 is present.
p75NTR+ cells were grown for 72 hours in the presence of RA, EDN3, RA with EDN3, or neither compound. When EDN3 was absent, the EDN signaling inhibitor BQ-788 was added to inhibit endogenous EDNRB signaling. Relative EDN3 (A-B) and Ece1 (C-D) mRNA levels were measured by quantitative RT-PCR after 3 (A, C) and 14 (B, D) days. Levels are normalized to β-actin and the -RA/-EDN3 condition was standardized to a value of 1. Solid lines denote a statistically significant difference (p<0.05) between “No RA” and “RA”, and broken lines indicate a p value >0.05. Asterisk denotes a statistically significant difference (p<0.05) between “No EDN3” and “EDN3”. (A) At 3 days, RA was associated with a net decrease in the level of EDN3 in the absence and presence of exogenous EDN3 (C) Similarly, RA was associated with a decrease in the relative abundance of Ece1, albeit only in the presence of EDN3 After 14 days, RA still decreased the relative abundance of EDN3 (B) and Ece1 (D) mRNA.

