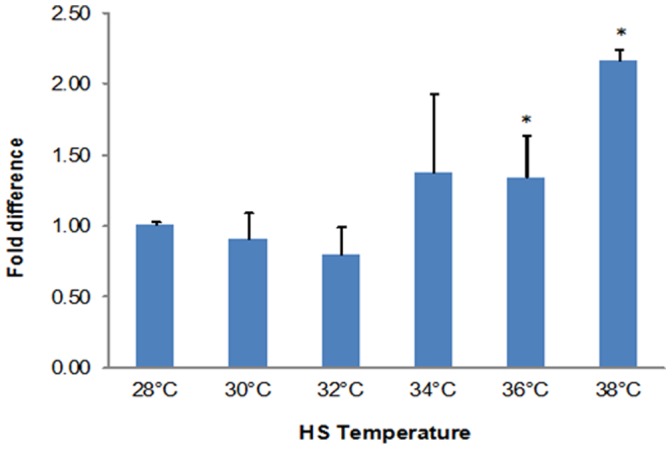
Figure 2. NLHS increased shrimp Hsp70 mRNA.

Post-larvae were exposed to 30 min heat shock from 28°C to 30°C, 32°C, 34°C, 36°C and 38°C, then transferred to 28°C for 8 h. Hsp70 mRNA was quantified by RT-qPCR, with beta-actin as reference. Bars represent the fold difference of Hsp70 mRNA with comparison to the non-heated control. The error bars represent the SD from 3 replicates. Asterisks denote statistically significant differences between values obtained for control and heat shocked post-larvae (P<0.05). The figure is a representation from two separate experiments.
