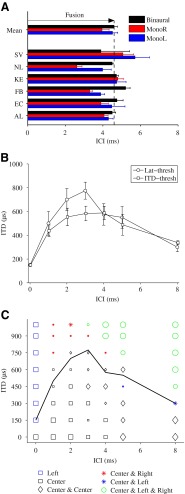
FIG. 2.
Psychoacoustical results. A Individual and mean results of the fusion test for binaural (black bars) and monaural stimulation (monaural right, red bars; monaural left, blue bars) by deviants with a lag-ITD of 300 μs. B Mean behavioral thresholds obtained from the lateralization test (circles) and ITD-detection test (squares). The error bars represent the standard error of the mean. C Lateralizations reported the most by the six subjects over three repetitions of the lateralization test (symbols) and mean lateralization threshold (black curve). The different markers represent the six response buttons (left, center, center and center, center and left, center and right, and center and left and right). The size of the symbols indicates at what percentage the lateralization was reported over 18 responses (six subjects, three repetitions): small symbols, below 50 %; medium symbols, between 50 and 70 %; large symbols, above 70 %.

