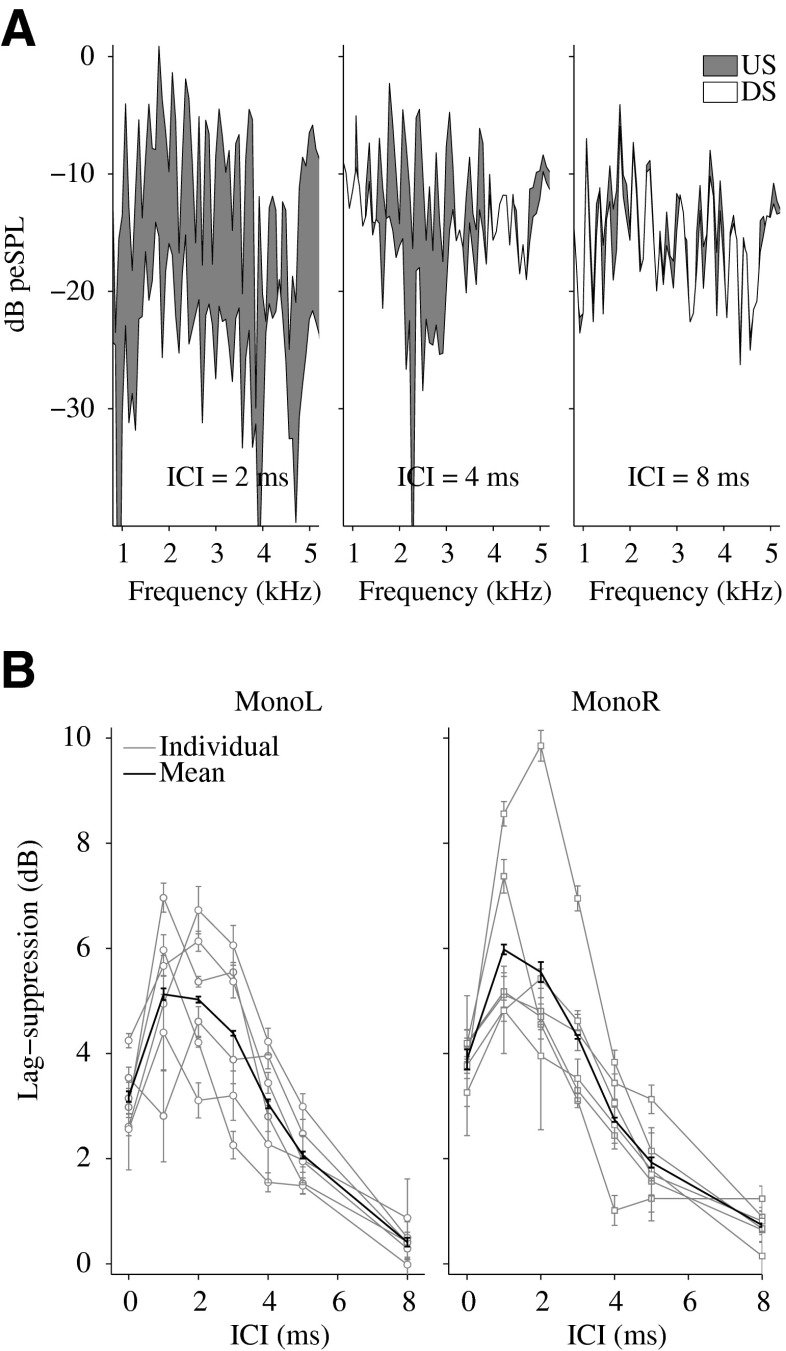
FIG. 3.
CEOAE results. A Spectra of the recorded CEOAEs for the single-click condition, i.e., the unsuppressed response (US), and for the derived suppressed response (DS, obtained from (DC-DCI)/2 in Fig. 1B) of the lagging click, for one representative subject KE. The difference between US and DS (the area displayed in gray) represents peripheral lag suppression for ICIs of 2, 4, 8 ms. B Individual (gray curves) and mean (black curves) results of peripheral lag suppression as a function of the ICI for monaural left and right stimulation. The error bars indicate the standard error of the mean.

