FIG. 4.
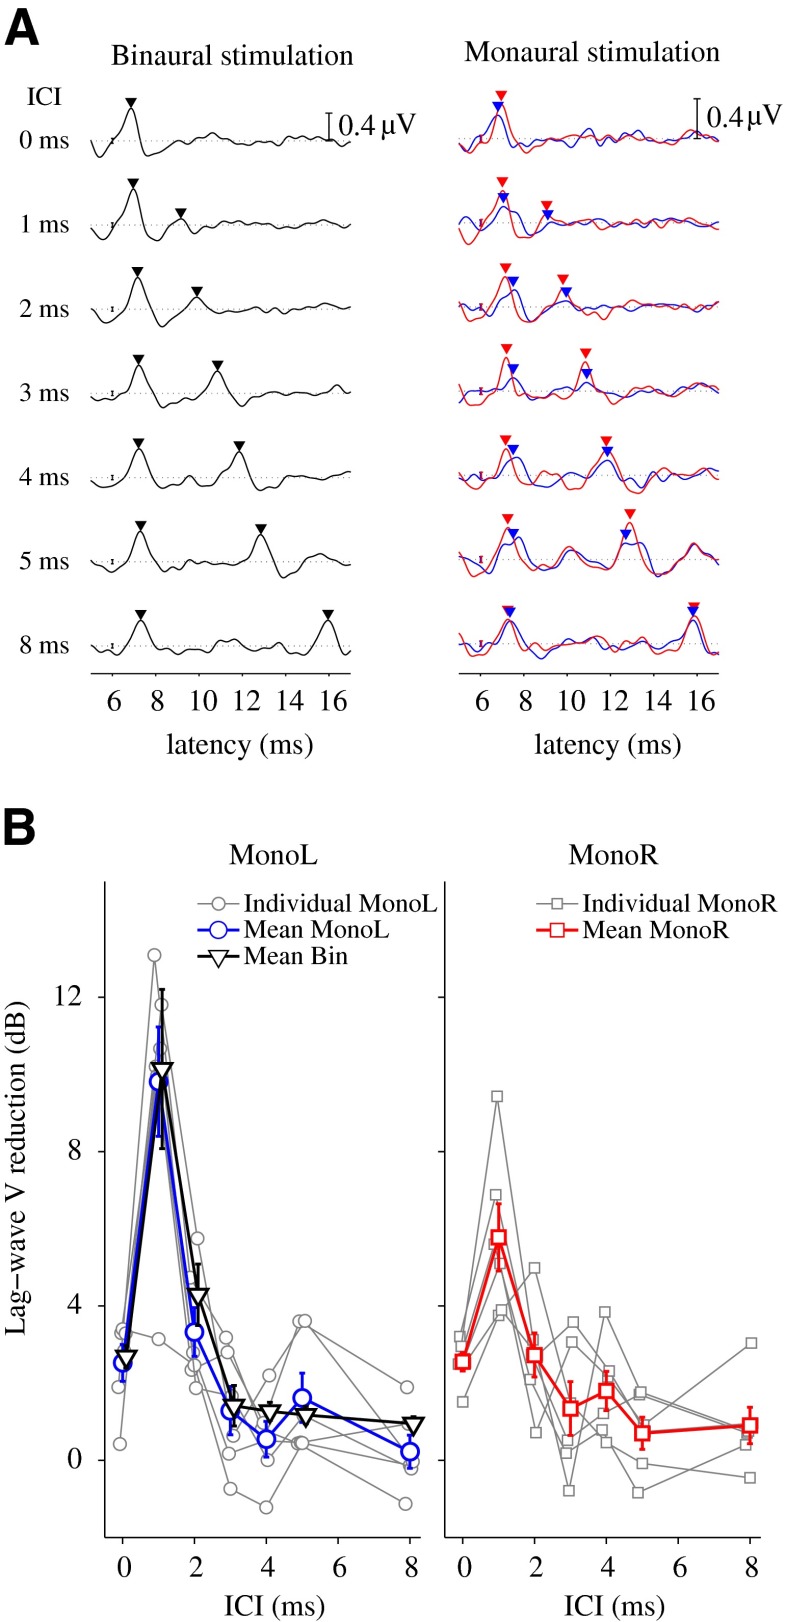
ABR results. A ABRs recordings for one representative subject KE, for monaural (right panel, red and blue curves) and binaural (left panel, black curve) stimulation and different ICI conditions. The error bars at a latency of 6 ms indicate the time-averaged SD of the recording. The horizontal dashed lines depict the zero voltage reference, and the bar scale at a latency of 16 ms indicates a voltage of 0.4 μV. B Individual (gray curves) and mean (black, blue, and red curves) results of lag wave V reduction obtained from ABRs recordings for monaural (gray, blue, and red curves) and binaural stimulation (black curve), as a function of ICI. The error bars indicate the standard error of the mean.

