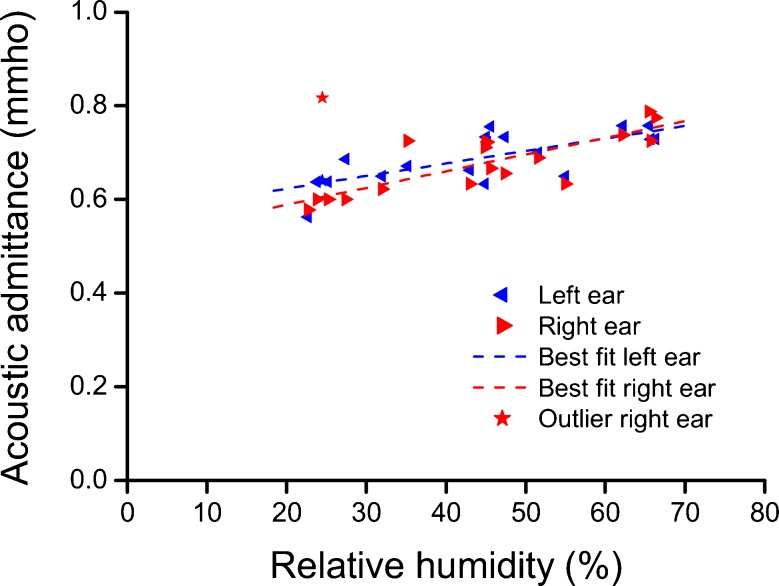
FIG. 4.
Relationship between the mean acoustic admittance across participants and the humidity during flight. The figure includes measurements made in the departure lounge, the flight, and the arrival lounge. Measurement of the mean acoustic admittance for the left ears is shown by the blue left-pointing triangles, and those from right ears are shown by the red right-pointing triangles. The outlier marked by the red asterisk was from right-ear measurements made at the start of descent. The blue and red lines show the least-squares fit to the left and right ear data, respectively, and exclude the outlier and the corresponding measurement from the left ear.

