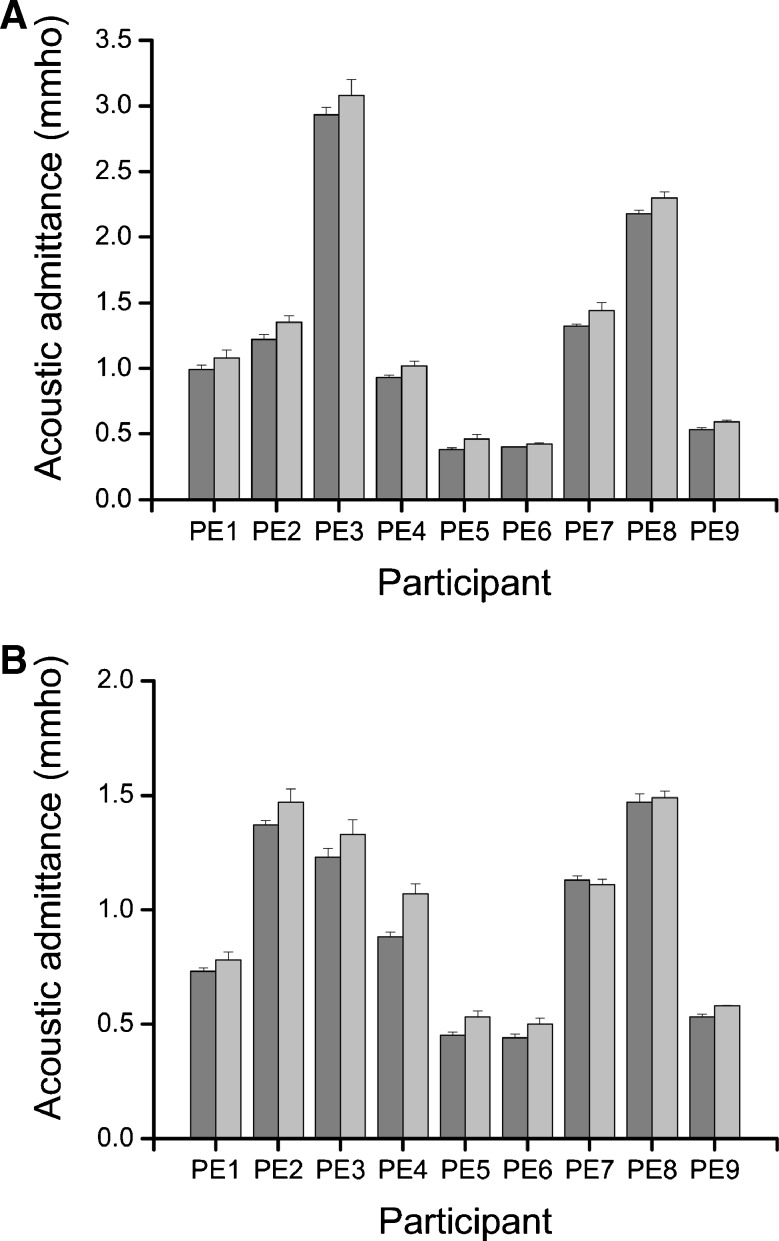
FIG. 5.
The effect of humidity on the acoustic admittance of the left ear (A) and right ear (B) for individual participants. The dark grey bars show the acoustic admittance for the low humidity condition, and the light grey bars show the acoustic admittance for the normal humidity condition. Errors bars show the standard error of the mean.

