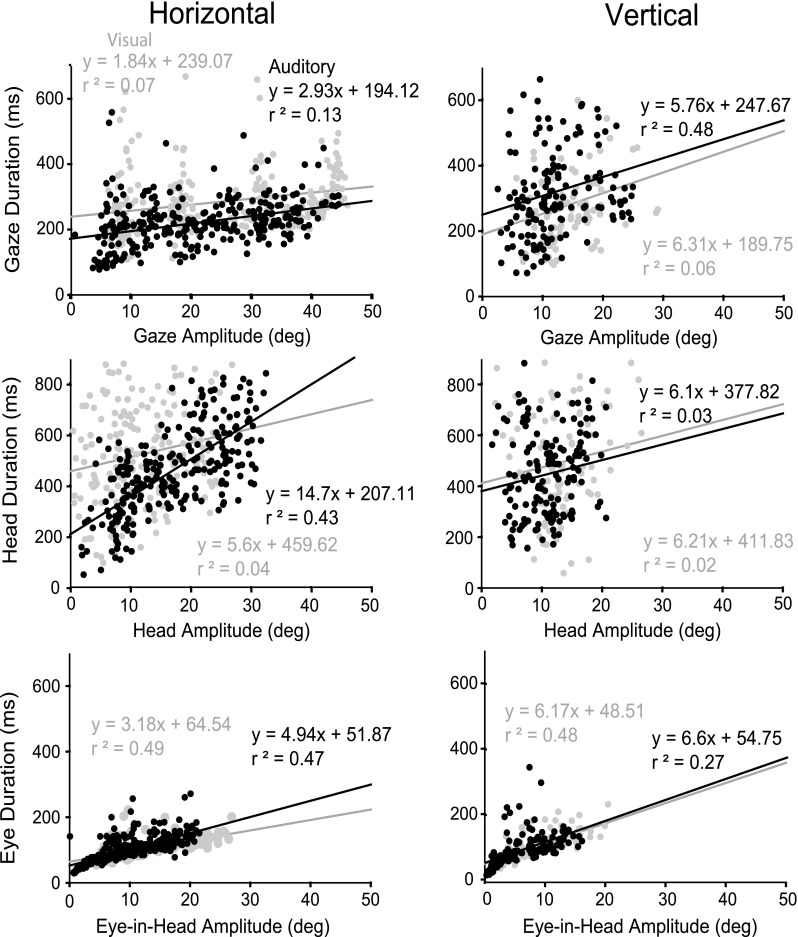
FIG. 10.

Representative duration of movement for one cat (21) plotted against amplitude for gaze (A), head (B), and eye in head (C), for horizontal (left) and vertical (right) long-duration auditory (black) and visual (gray) targets. Black and gray lines indicate linear regressions for auditory and visual sources, respectively.
