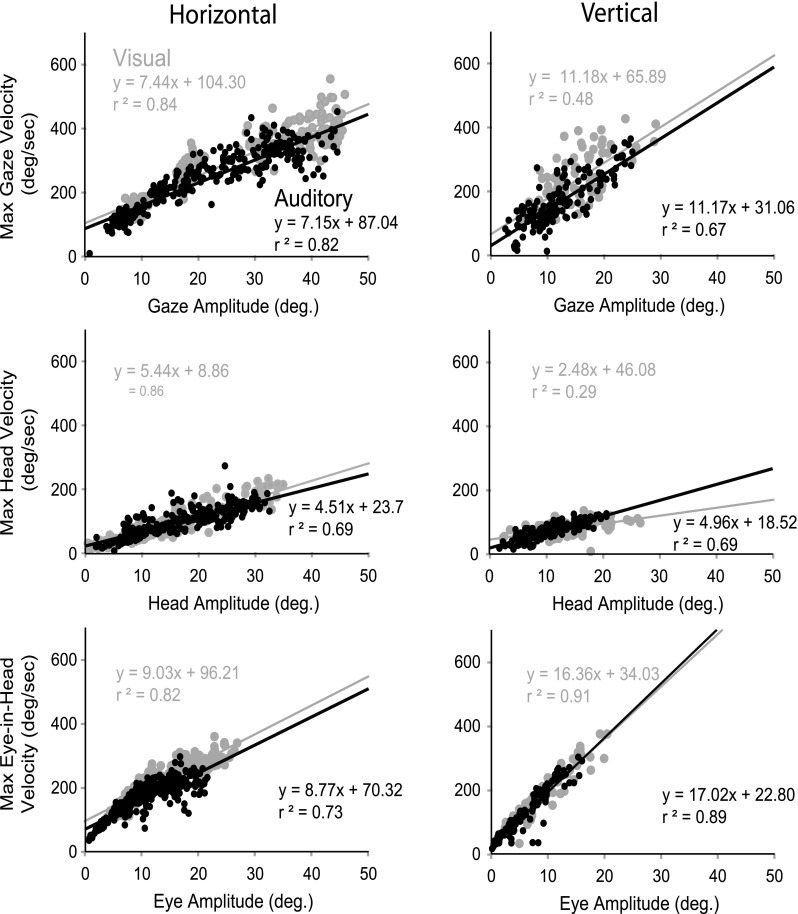
FIG. 9.

Representative plot of main sequence for one cat (18) relating peak velocity and amplitude for gaze (A), head (B), and eye in head (C), for horizontal (left) and vertical (right) long-duration auditory (black) and visual (gray) targets. Black and gray lines indicate linear regressions for auditory and visual sources, respectively.
